Fig. 1.
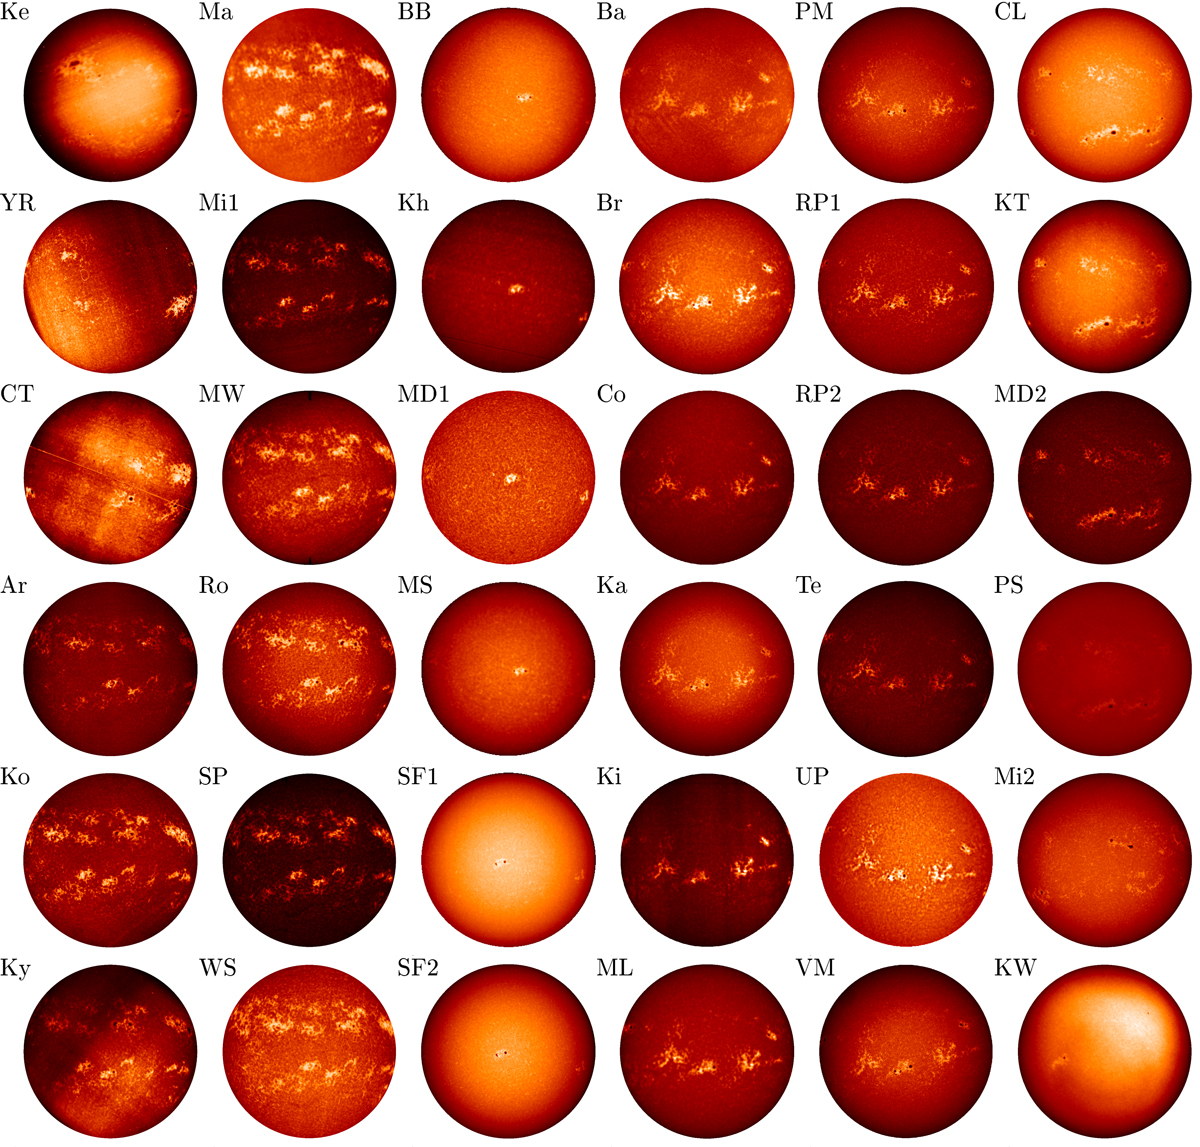
Examples of observations from the various archives analysed in this study, with the exception of MM and Sc. Aside from the images in the first and last column, the images within each column correspond to roughly the same day. Within a column, the images are shown in alphabetical order according to the name of the observatory, given by a 2-letter abbreviation, with a numeral added in some cases (see Table 1 for the corresponding observatory name). The specific dates of the observations are: 14/07/1892 for Ke; 16/02/1907 for YR; 04/09/1908 for CT; 03/02/1968 for Ma; 04/02/1968 for Ko, Ky, Mi1, MW, and SP; 05/02/1968 for Ar, Ro, and WS; 16/07/1995 for BB, Kh, MD1, and MS; 15/07/1995 for SF1 and SF2; 13/03/2014 for Ba, Br, Co, Ka, Ki, ML, PM, RP1, RP2, Te, UP, and VM; 01/08/2012 for CL, KT, MD2, and PS; 10/07/2015 for Mi2; 23/04/2018 for KW; respectively. The images are shown after pre-processing to identify the disc and re-sample them to account for the disc’s ellipticity (when applicable) and convert the historical data to density values. The images have been roughly aligned to show the Solar north pole at the top.
Current usage metrics show cumulative count of Article Views (full-text article views including HTML views, PDF and ePub downloads, according to the available data) and Abstracts Views on Vision4Press platform.
Data correspond to usage on the plateform after 2015. The current usage metrics is available 48-96 hours after online publication and is updated daily on week days.
Initial download of the metrics may take a while.