Free Access
Fig. 7
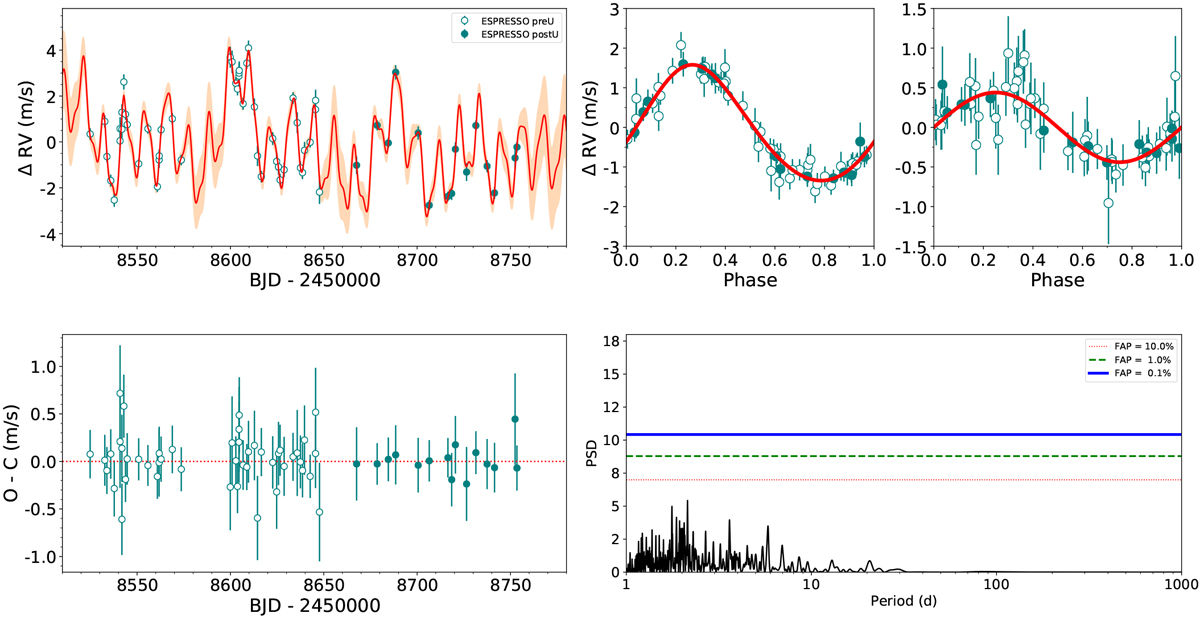
Top-left panel: ESPRESSO RVs along with the best fit using a Keplerian, a sinusoidal, and the activity model. Top-right panel: phase folded RV curve of the 11.2d and 5.15d signals. Bottom-left panel: residuals after the fit of the full model. Bottom-right panel: GLS periodogram of the residuals.
Current usage metrics show cumulative count of Article Views (full-text article views including HTML views, PDF and ePub downloads, according to the available data) and Abstracts Views on Vision4Press platform.
Data correspond to usage on the plateform after 2015. The current usage metrics is available 48-96 hours after online publication and is updated daily on week days.
Initial download of the metrics may take a while.