Fig. A.1
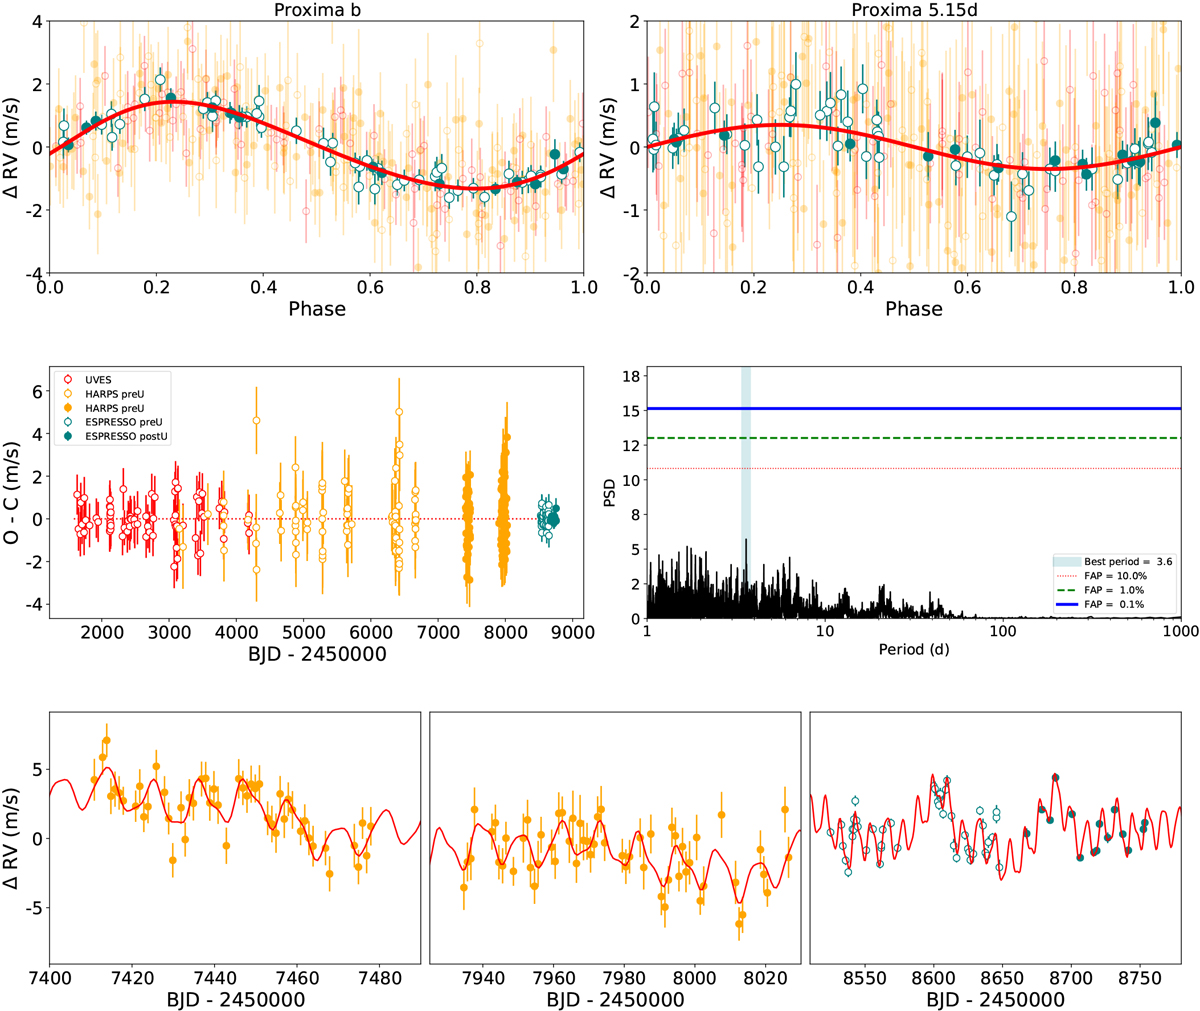
Top panels: phase folded RV curve of the Keplerian and the 5d sinusoidal signals, after subtracting the GP component. Middle panels: residuals after fitting and their periodogram. Bottom panel: zoom on the RV measurements of the different high cadence campaigns along with the best model fit from the joint GP mode of the FWHM and the RVs.
Current usage metrics show cumulative count of Article Views (full-text article views including HTML views, PDF and ePub downloads, according to the available data) and Abstracts Views on Vision4Press platform.
Data correspond to usage on the plateform after 2015. The current usage metrics is available 48-96 hours after online publication and is updated daily on week days.
Initial download of the metrics may take a while.