Fig. 19
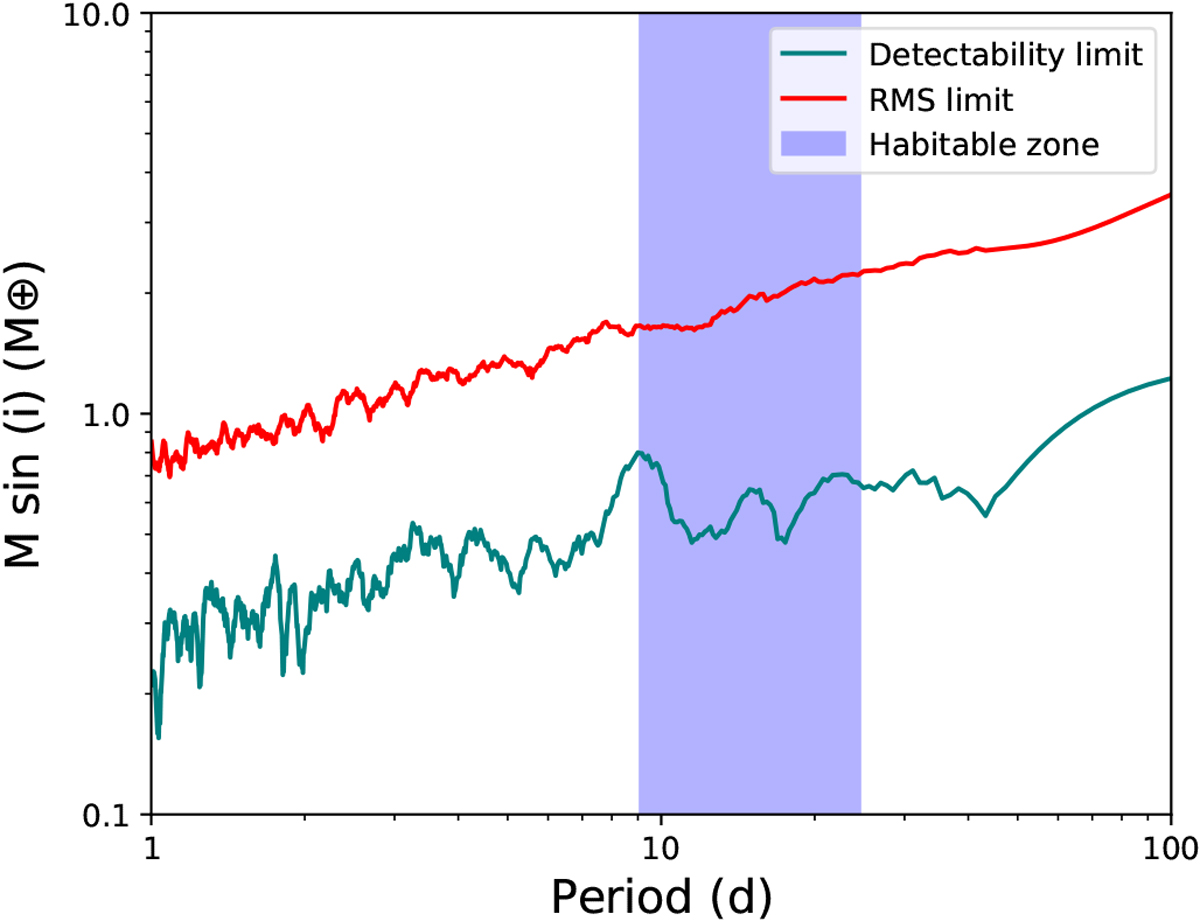
Detection limits for the presence of additional planets around Proxima. The red line shows the limit imposed by the total dispersion of the RV measurements. More massive planets would cause a RV dispersion too large to be explained by the data we collected. The teal line shows the limit above which we should have detected the planets with our current dataset. The blue region shows the periods corresponding to the habitable zone around the star.
Current usage metrics show cumulative count of Article Views (full-text article views including HTML views, PDF and ePub downloads, according to the available data) and Abstracts Views on Vision4Press platform.
Data correspond to usage on the plateform after 2015. The current usage metrics is available 48-96 hours after online publication and is updated daily on week days.
Initial download of the metrics may take a while.