Free Access
Fig. 14
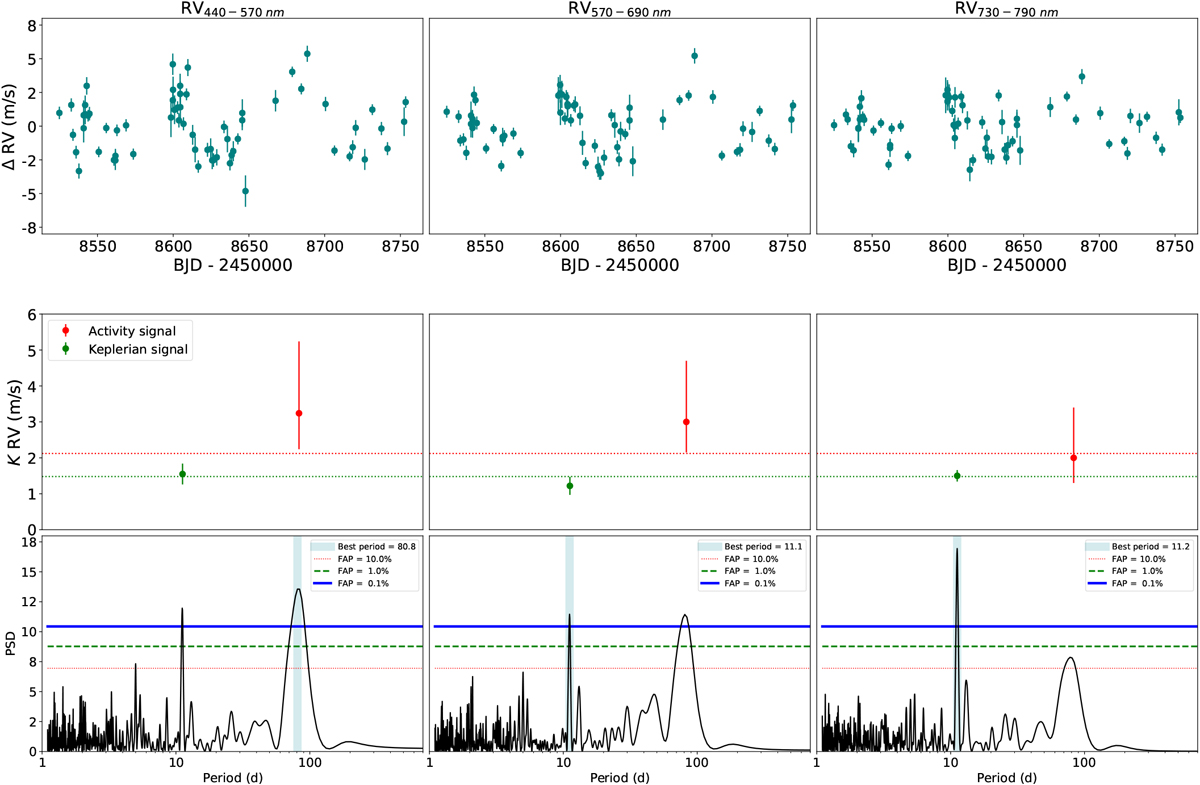
Top panels: RV data measured at different wavelength bins. Middle panels: amplitude of the Keplerian and activity signals for the different wavelength bins. The horizontal lines show the measurement using the complete wavelength range. Bottom panels: GLS periodograms of the data at the same wavelength bins.
Current usage metrics show cumulative count of Article Views (full-text article views including HTML views, PDF and ePub downloads, according to the available data) and Abstracts Views on Vision4Press platform.
Data correspond to usage on the plateform after 2015. The current usage metrics is available 48-96 hours after online publication and is updated daily on week days.
Initial download of the metrics may take a while.