Open Access
Fig. 7
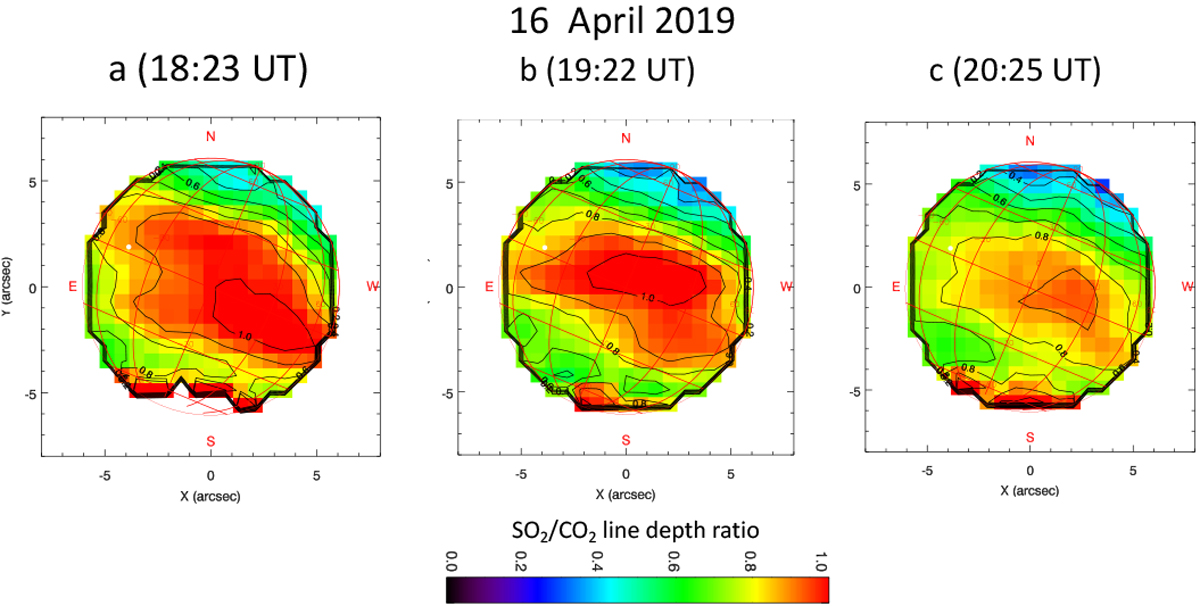
Maps of the line depth ratio of a weak SO2 multiplet (around 1345.1 cm−1) to the CO2 transition at 1345.22 cm−1, recorded onApril 16, 2019. The figure on the left (18:23 UT) is the same as in Fig. 6. The sub-solar point is shown as a white dot. Times refer to the mid-times of the observations.
Current usage metrics show cumulative count of Article Views (full-text article views including HTML views, PDF and ePub downloads, according to the available data) and Abstracts Views on Vision4Press platform.
Data correspond to usage on the plateform after 2015. The current usage metrics is available 48-96 hours after online publication and is updated daily on week days.
Initial download of the metrics may take a while.