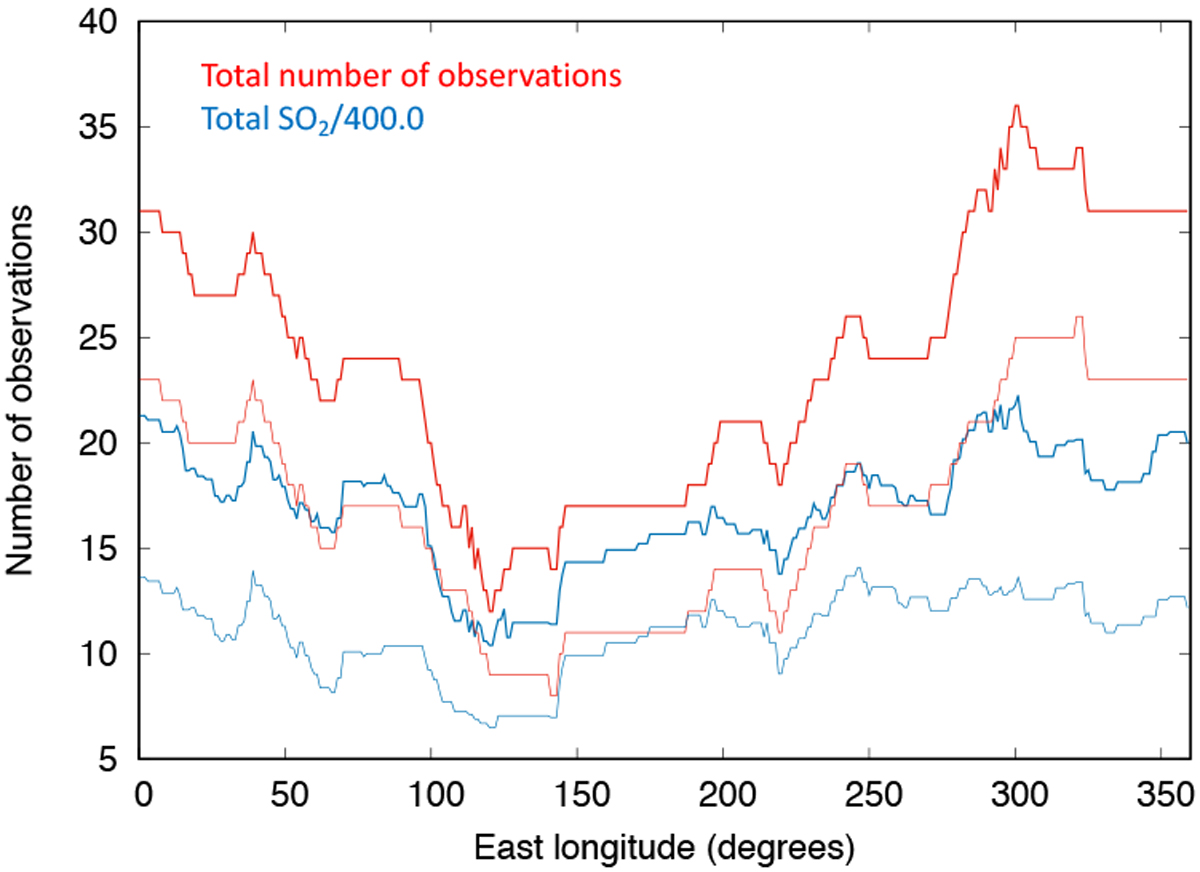
Fig. 20

Red curve: summation of all longitudes observed by TEXES over the 2012–2019 period. This curve is the same as the red curve in Fig. 18. Blue curve: summation of all SO2 vmr distributions vs longitude, using the same dataset. For each observation, the normalized distribution of the SO2 vmr as a function of longitude is calculated as described in the text. The sum of all SO2 vmrs has been divided by 400.0 ppbv. Thick points: results with the whole dataset (2012–2019); thin points: dataset without the 2019 data.
Current usage metrics show cumulative count of Article Views (full-text article views including HTML views, PDF and ePub downloads, according to the available data) and Abstracts Views on Vision4Press platform.
Data correspond to usage on the plateform after 2015. The current usage metrics is available 48-96 hours after online publication and is updated daily on week days.
Initial download of the metrics may take a while.


