Fig. 19
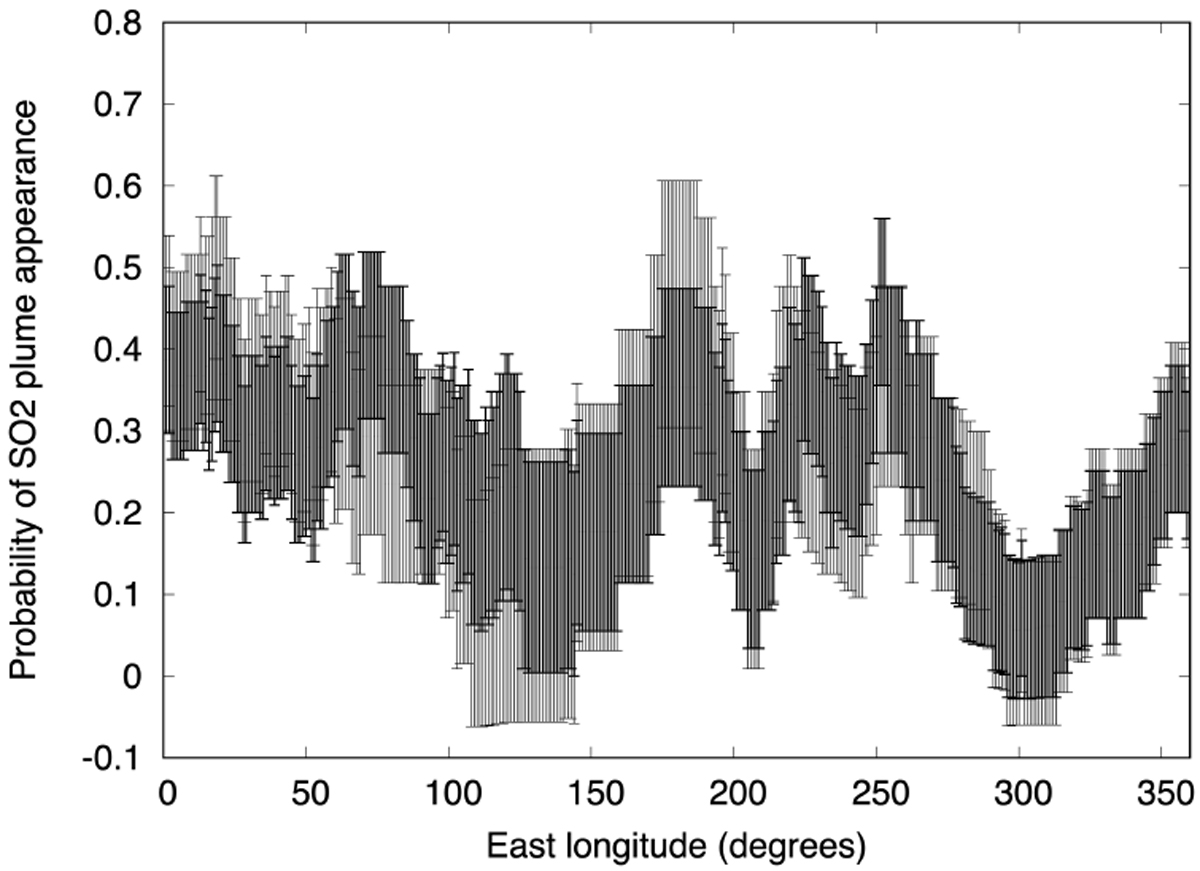
Probability of SO2 appearance as a function of longitude, using the data shown in Table 1 of E19 and Table 2 of this paper. The error bar is proportional to n−0.5, where n is the number of observations for which the longitude is observed (red curve in Fig. 18). Thick points: Results with the whole dataset (2012–2019); thin points: dataset without the 2019 data.
Current usage metrics show cumulative count of Article Views (full-text article views including HTML views, PDF and ePub downloads, according to the available data) and Abstracts Views on Vision4Press platform.
Data correspond to usage on the plateform after 2015. The current usage metrics is available 48-96 hours after online publication and is updated daily on week days.
Initial download of the metrics may take a while.