Fig. 16
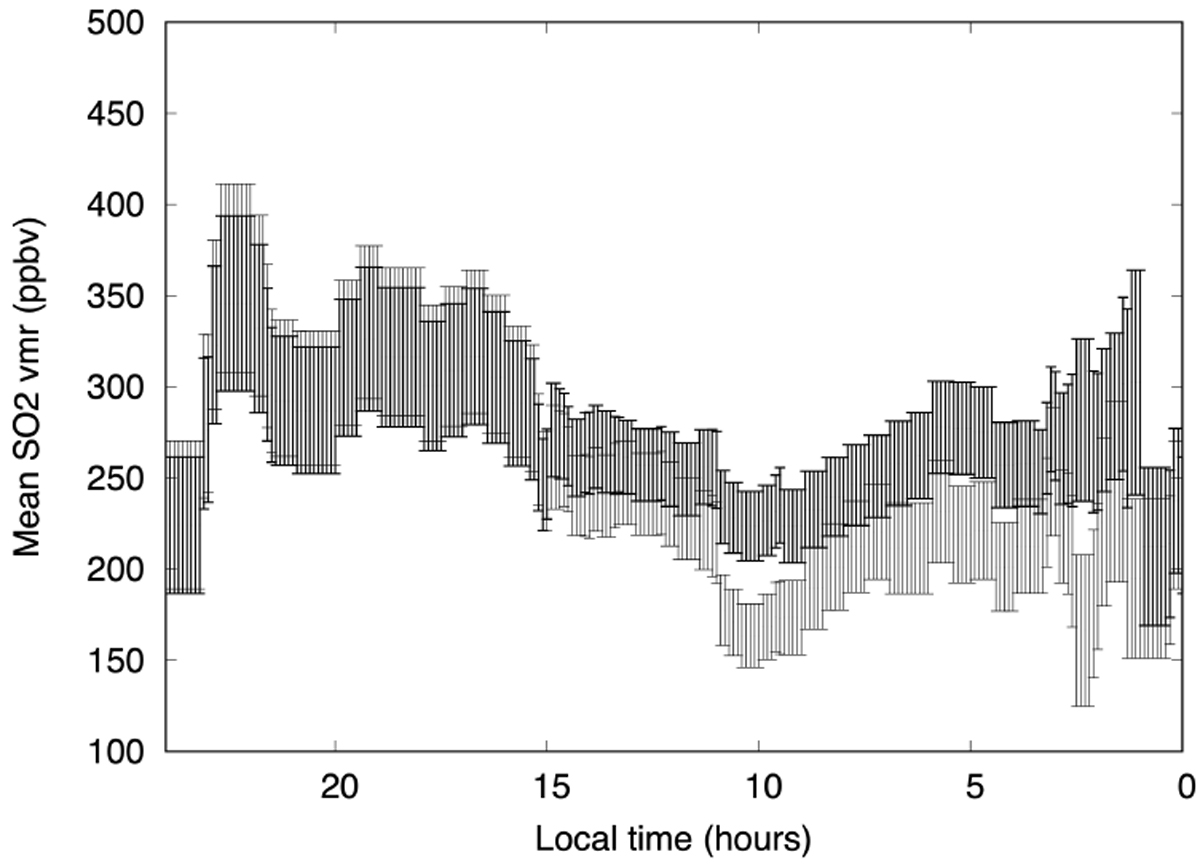
Thick points: distributions of the SO2 vmr as a function of local time, calculated as the ratio of the blue curve to the red curve in Fig. 15. The error bar is proportional to n−0.5, where n is the number of observations for which the local time is observed (red curve in Fig. 15). Thin points: results using the dataset without the 2019 runs (34 points).
Current usage metrics show cumulative count of Article Views (full-text article views including HTML views, PDF and ePub downloads, according to the available data) and Abstracts Views on Vision4Press platform.
Data correspond to usage on the plateform after 2015. The current usage metrics is available 48-96 hours after online publication and is updated daily on week days.
Initial download of the metrics may take a while.