Fig. 11
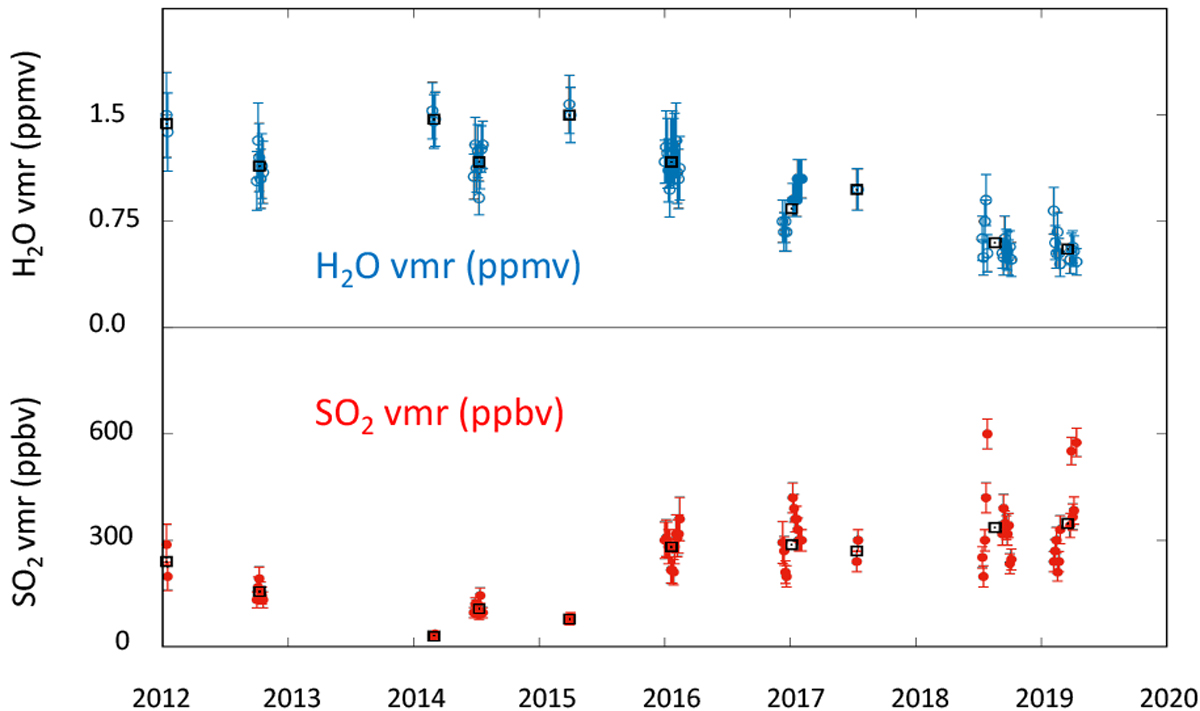
Long-term variations of the H2O volume mixing ratio (top, blue points), inferred from the HDO measurements, and the SO2 volume mixing ratio (bottom, red points), measured at the cloud top from the TEXES data at 7.4 μm. A daily mean is shown in this figure. The black squares are the mean values of the H2O and SO2 mixing ratios averaged over each run. In 3 cases (Dec. 2017–Jan. 2018, July-Sept. 2018, Feb.–Apr. 2019), we have co-added alldata (separated by less than 3 months), in order to have a more homogeneous time sampling over the long term.
Current usage metrics show cumulative count of Article Views (full-text article views including HTML views, PDF and ePub downloads, according to the available data) and Abstracts Views on Vision4Press platform.
Data correspond to usage on the plateform after 2015. The current usage metrics is available 48-96 hours after online publication and is updated daily on week days.
Initial download of the metrics may take a while.