Fig. 10
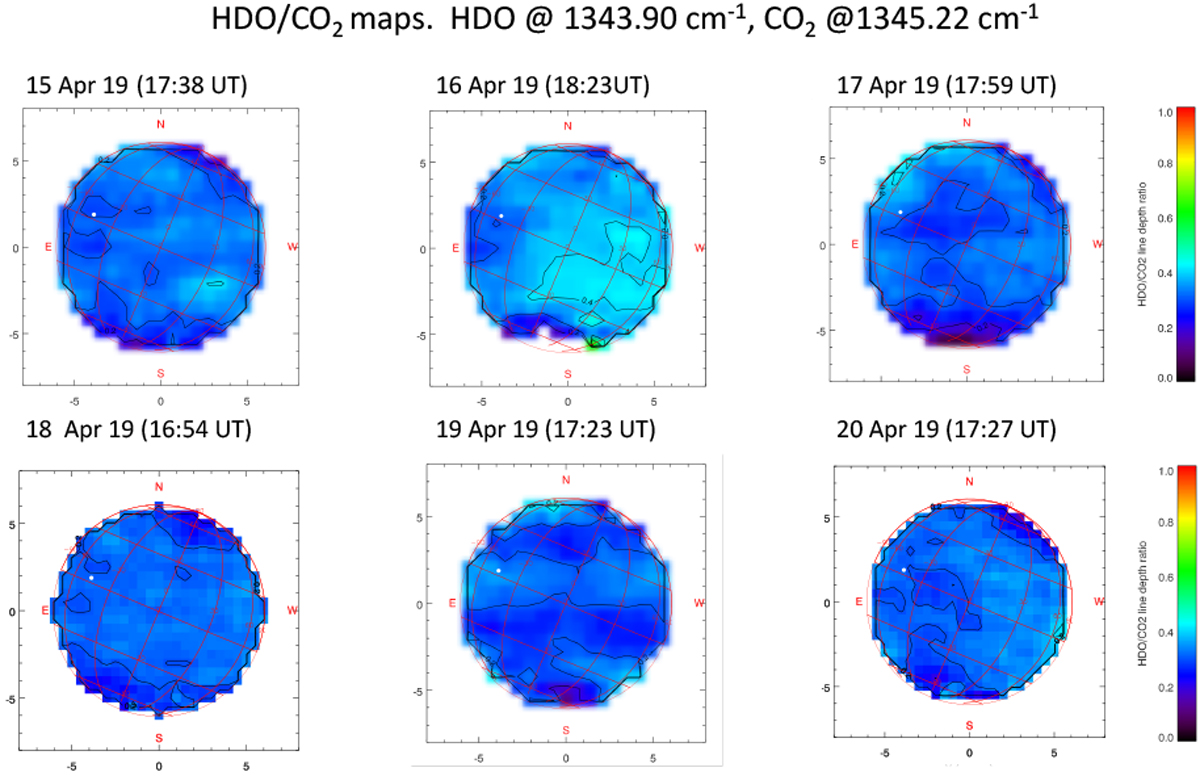
Examples of maps of the line depth ratio of the weak HDO transition (at 1344.90 cm−1) to the CO2 transition at 1345.22 cm−1, recorded during the April 2019 run. Data are the same as in Figs. 3 and 6. The sub-solar point is shown as a white dot. Times refer to the mid-times of the observations. Data of April 21–24 are not shown because theterrestrial atmospheric absorption (see Fig. 3) is too strong for the HDO retrieval to be reliable.
Current usage metrics show cumulative count of Article Views (full-text article views including HTML views, PDF and ePub downloads, according to the available data) and Abstracts Views on Vision4Press platform.
Data correspond to usage on the plateform after 2015. The current usage metrics is available 48-96 hours after online publication and is updated daily on week days.
Initial download of the metrics may take a while.