Fig. 4.
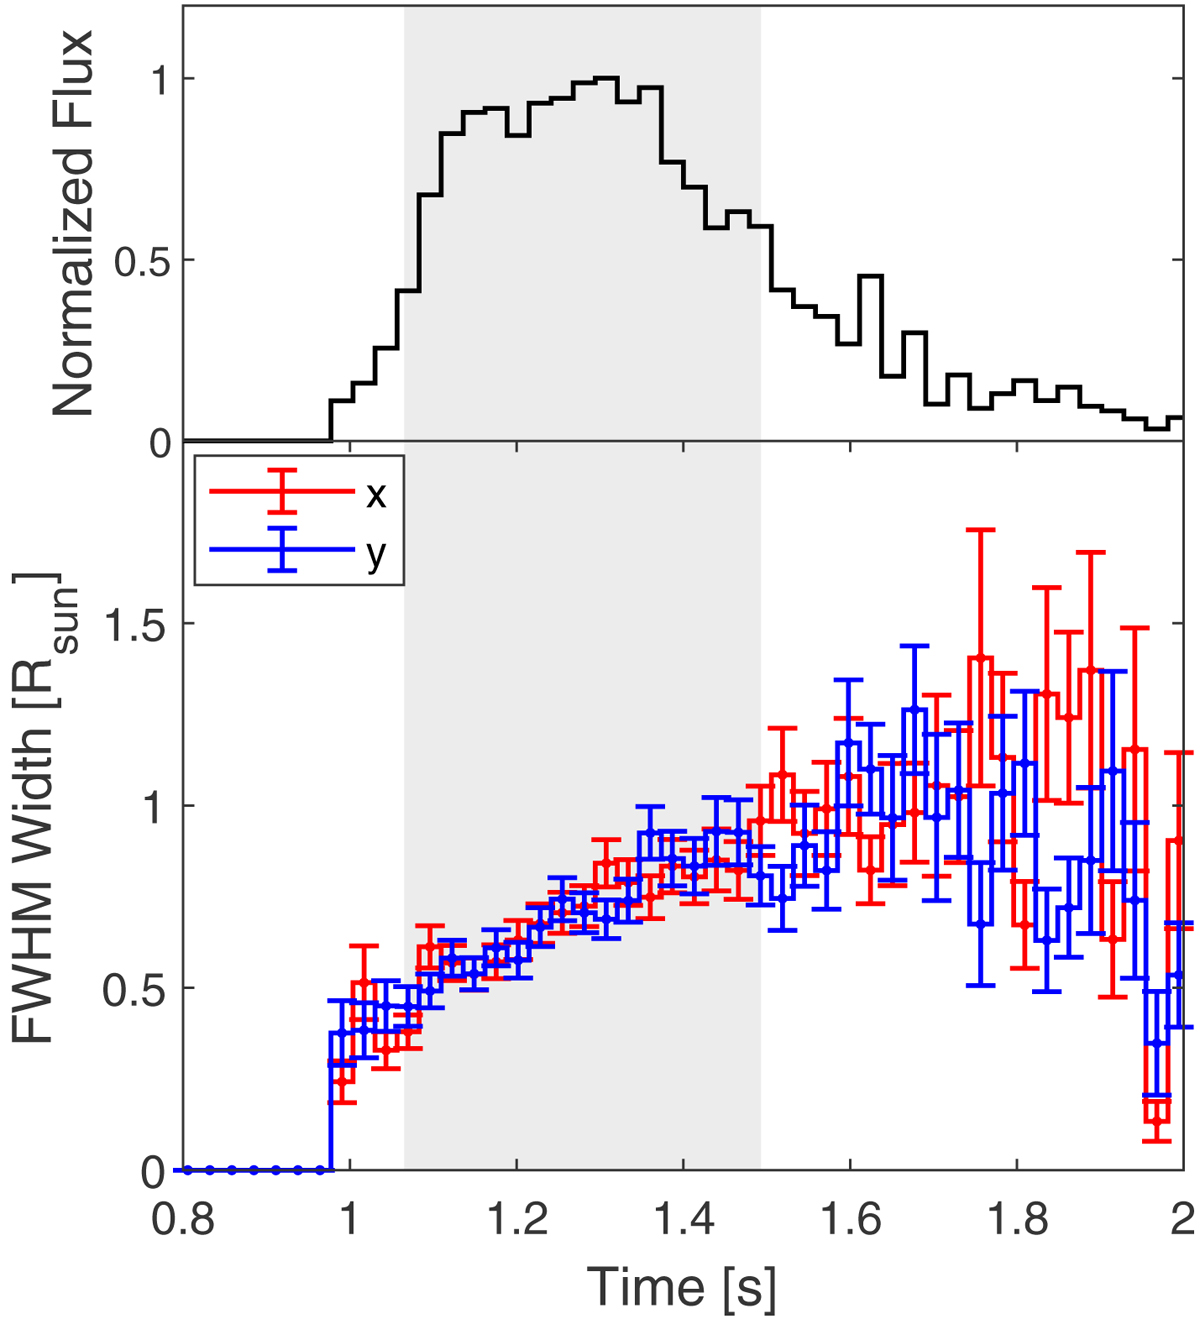
Simulation result of the observed flux (upper panel) and the apparent source size (width) along the x and y axis (lower panel) for a impulse point source with frequency 26 MHz located at the solar disk center. In the simulation, we use a turbulence level of ϵ = 0.3 and an isotropic parameter of α = 0.3. The gray area represents the time range of the flux FWHM.
Current usage metrics show cumulative count of Article Views (full-text article views including HTML views, PDF and ePub downloads, according to the available data) and Abstracts Views on Vision4Press platform.
Data correspond to usage on the plateform after 2015. The current usage metrics is available 48-96 hours after online publication and is updated daily on week days.
Initial download of the metrics may take a while.