Fig. 3.
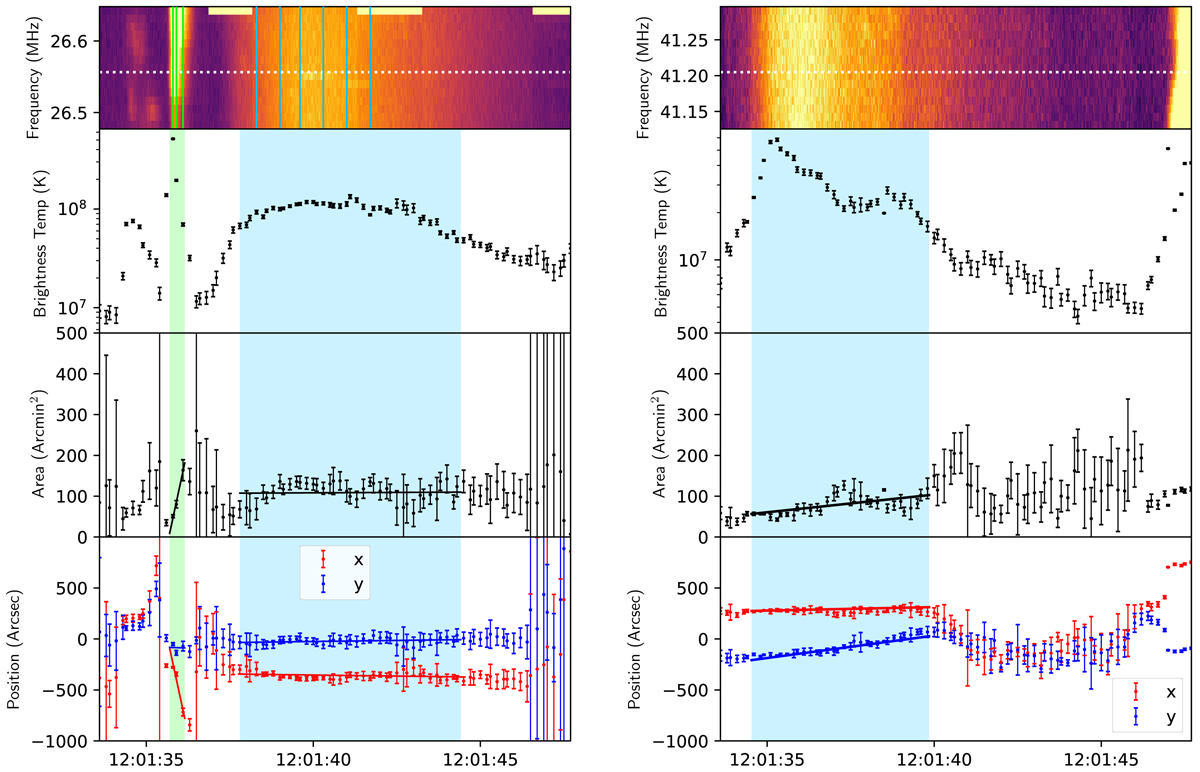
Dynamic spectra of subband SB008 (left) and SB021 (right) with center frequencies of 26.56 MHz and 41.21 MHz (top panel), the source brightness temperature (second panel), and the size and position of these two subbands (third and fourth panel). The fundamental part is marked as green shadow, the harmonic part is marked as blue shadow, and the error bar marks the uncertainty.
Current usage metrics show cumulative count of Article Views (full-text article views including HTML views, PDF and ePub downloads, according to the available data) and Abstracts Views on Vision4Press platform.
Data correspond to usage on the plateform after 2015. The current usage metrics is available 48-96 hours after online publication and is updated daily on week days.
Initial download of the metrics may take a while.