Fig. 2.
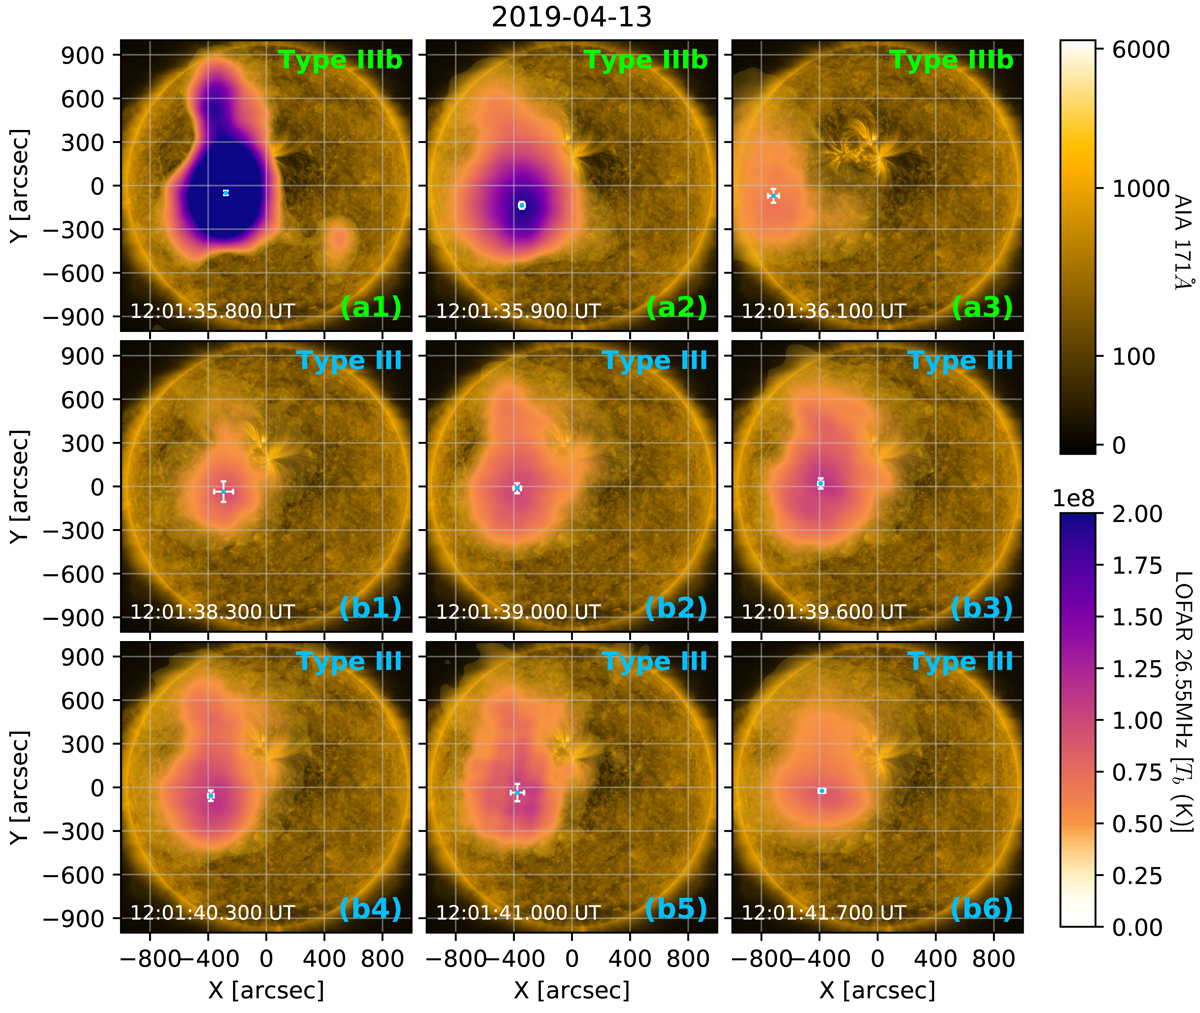
Interferometry observation of the type IIIb-III pair. Panel (a1–3) is the interferometric image of the fundamental (type IIIb) part, and Panel (b1–6) shows the second harmonic (type III) part in subband SB008 (26.56 MHz). The radio flux intensity is overlaid on the EUV image observed by SDO/AIA at 12:01:33 UT. The unit of radio flux intensity in this is converted to brightness temperature (Kelvin). The times of snapshots are marked by vertical green or blue lines in the left-top sub-panel of Fig. 3. The peak position of the radio flux intensity is marked by a blue dot with position uncertainty marked as a white error bar in each snapshot. An animation of this figure is available online.
Current usage metrics show cumulative count of Article Views (full-text article views including HTML views, PDF and ePub downloads, according to the available data) and Abstracts Views on Vision4Press platform.
Data correspond to usage on the plateform after 2015. The current usage metrics is available 48-96 hours after online publication and is updated daily on week days.
Initial download of the metrics may take a while.