Fig. 8
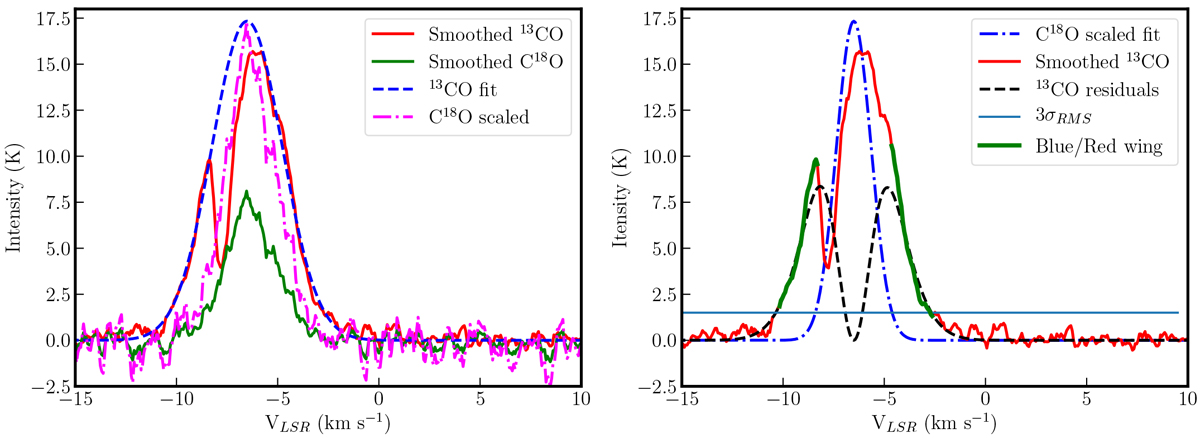
Application of the method described in Sect. 3.4 to source 2 of region A. Left: 13CO and C18O spectra convolved with a 1D box of 5 pixels (continuous red and green lines), the Gaussian fit of the 13CO to correct forthe self-absorption (dashed blue line), and the C18O spectrum scaled to the peak of the 13CO Gaussian fit (dashed-point magenta line). Right: Gaussian fit to the scaled C18O spectrum (dashed-point blue line), 13CO residual (dashed black line) resulting from the subtraction of the scaled C18O Gaussian from the 13CO Gaussian, and the blue and red wings (green line).
Current usage metrics show cumulative count of Article Views (full-text article views including HTML views, PDF and ePub downloads, according to the available data) and Abstracts Views on Vision4Press platform.
Data correspond to usage on the plateform after 2015. The current usage metrics is available 48-96 hours after online publication and is updated daily on week days.
Initial download of the metrics may take a while.