Fig. 3
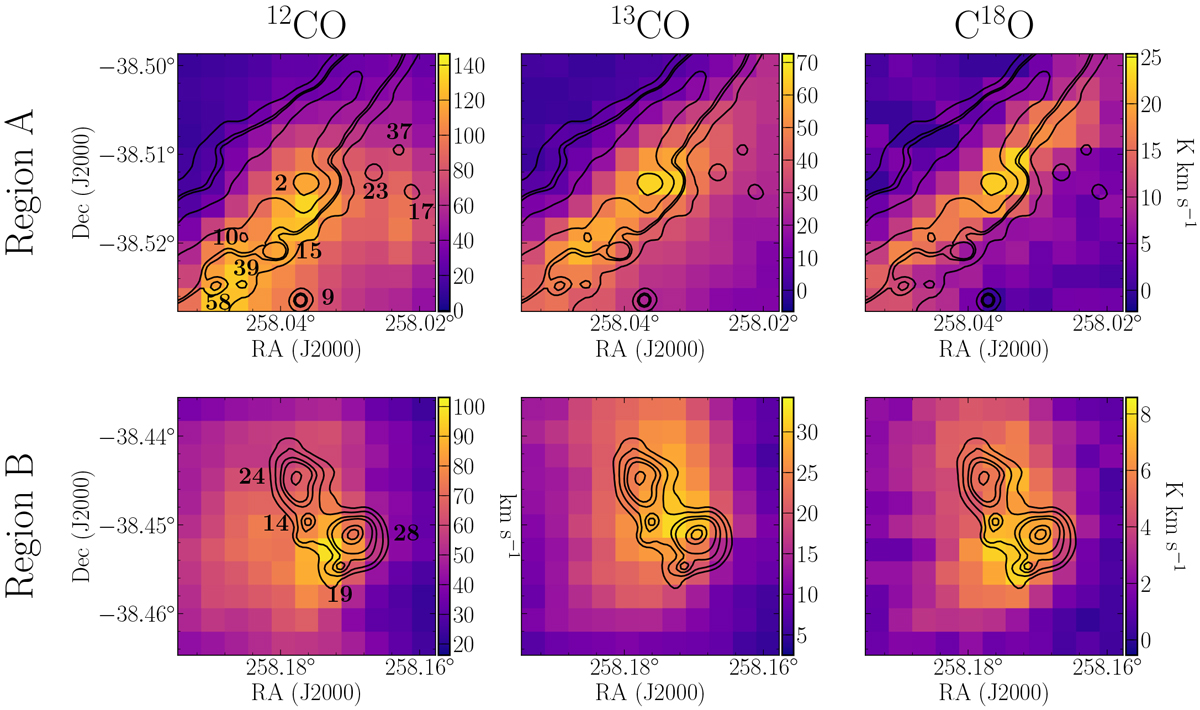
Velocity integrated intensity of the 12CO (3−2) (first column), 13CO (3−2) (second column), and C18O (3−2) (third column) for regions A (top) and B (bottom). The velocity range used for integration is − 20.1 < VLSR < 8.2 km s−1, − 15.0 < VLSR < 3.1 km s−1, and − 12.0 < VLSR < −2.3 km s−1 for 12CO (3−2), 13CO (3−2), and C18O (3−2), respectively. Contours represent the emission at 70 μm from Herschel and the cores (labels are slightly shifted from the true position of the cores) which were extracted in Figueira et al. (2017).
Current usage metrics show cumulative count of Article Views (full-text article views including HTML views, PDF and ePub downloads, according to the available data) and Abstracts Views on Vision4Press platform.
Data correspond to usage on the plateform after 2015. The current usage metrics is available 48-96 hours after online publication and is updated daily on week days.
Initial download of the metrics may take a while.