Fig. 11
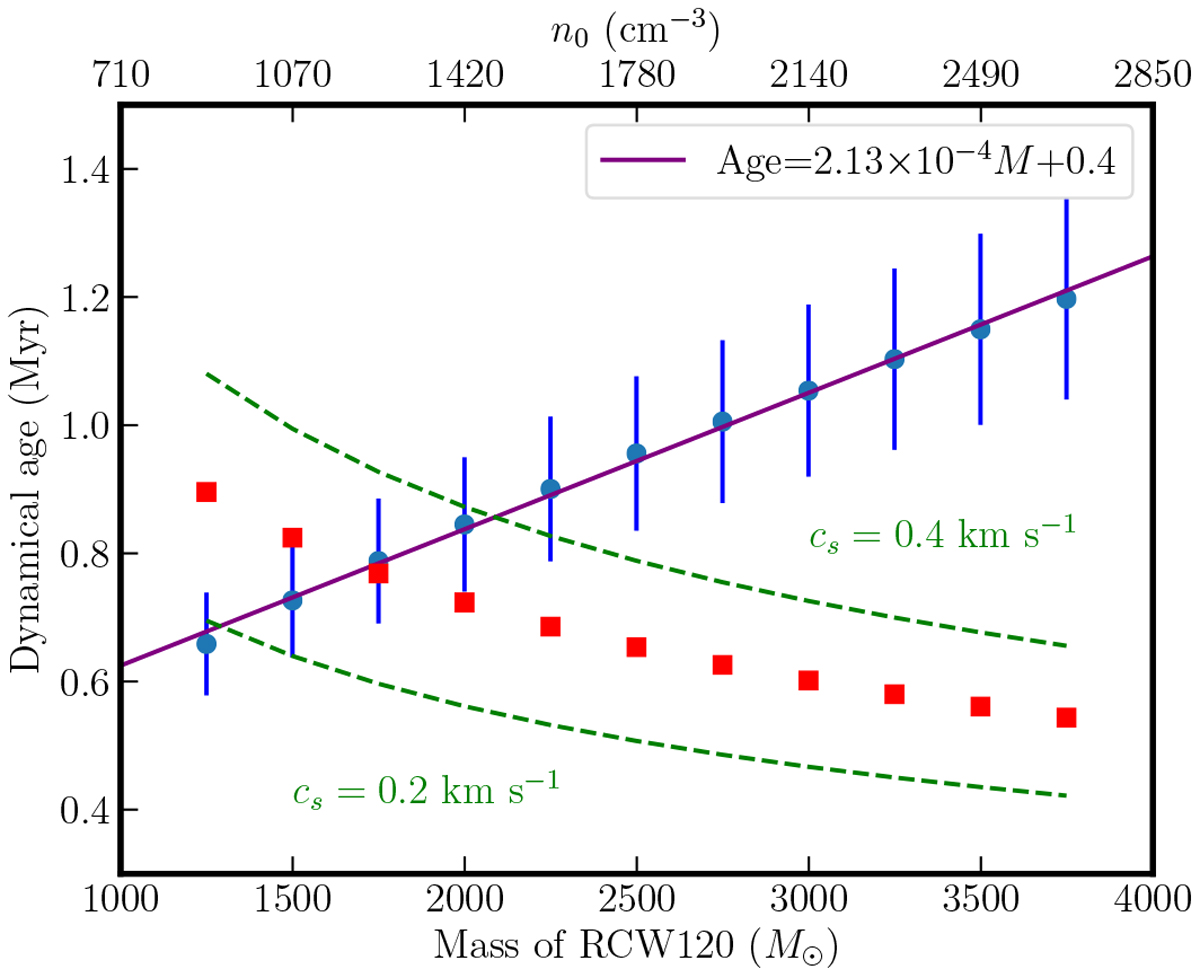
Dynamical age as a function of the mass (bottom axis) and as a function of initial density (top axis) of RCW 120 (blue dot), with the uncertainty associated to each of them (blue bars) and the linear fit (purple line). The fragmentation timescale following the model of Whitworth et al. (1994) is plotted for NLyC = 1048 s−1 and cs = 0.3 (red squares), and for cs = 0.2, 0.4 km s−1 (green dashed lines).
Current usage metrics show cumulative count of Article Views (full-text article views including HTML views, PDF and ePub downloads, according to the available data) and Abstracts Views on Vision4Press platform.
Data correspond to usage on the plateform after 2015. The current usage metrics is available 48-96 hours after online publication and is updated daily on week days.
Initial download of the metrics may take a while.