Fig. 10
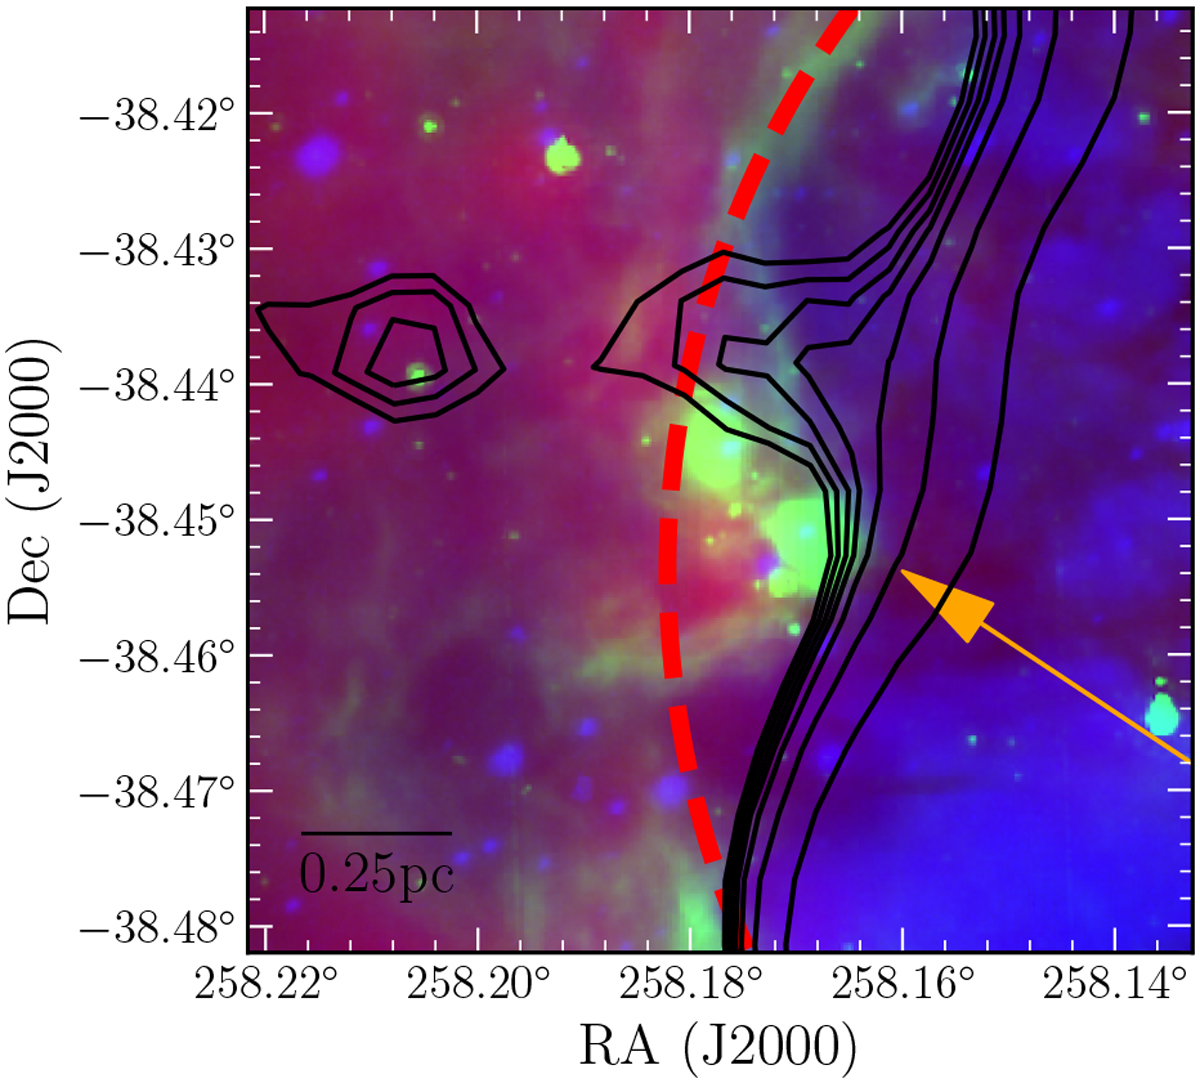
Observation of region B from Spitzer at 8 μm, where the red dashed line represents the circle which follows the 8 μm emission, the black contours represent the free-free emission from SUMSS (contours from 0.01 to 0.04 Jy beam−1), and the orange arrow indicates the direction of the ionizing radiation. The clump with the tails is inside the circle.
Current usage metrics show cumulative count of Article Views (full-text article views including HTML views, PDF and ePub downloads, according to the available data) and Abstracts Views on Vision4Press platform.
Data correspond to usage on the plateform after 2015. The current usage metrics is available 48-96 hours after online publication and is updated daily on week days.
Initial download of the metrics may take a while.