Free Access
Fig. 1
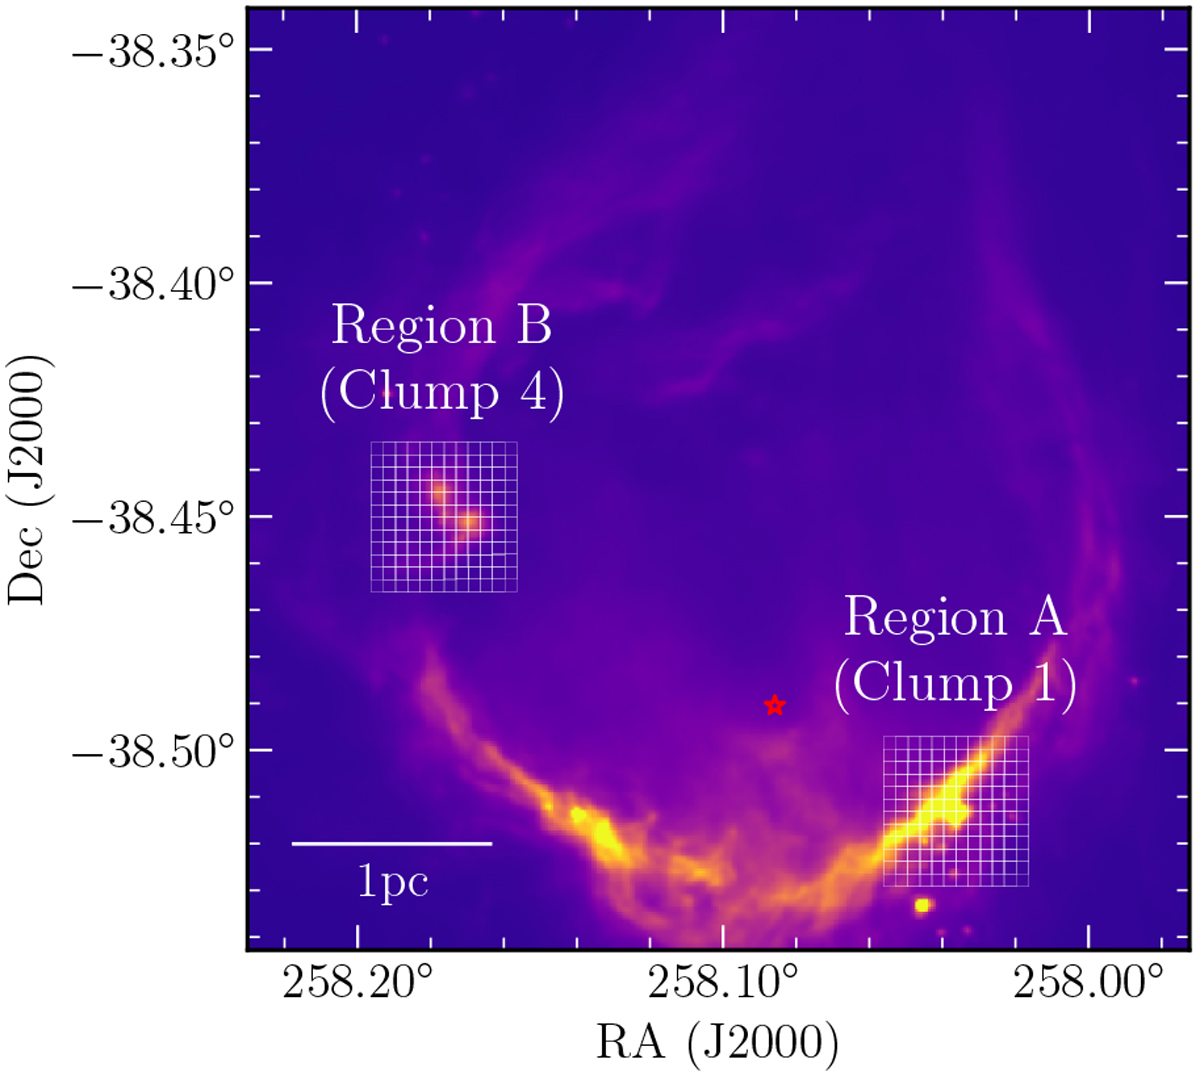
Herschel 70 μm observation of RCW 120. The two grids (in white) represent the APEX observations with 121 ON observations per grid separated by half the beam for a width of 105′′. The ionizing star is represented by the red star symbol.
Current usage metrics show cumulative count of Article Views (full-text article views including HTML views, PDF and ePub downloads, according to the available data) and Abstracts Views on Vision4Press platform.
Data correspond to usage on the plateform after 2015. The current usage metrics is available 48-96 hours after online publication and is updated daily on week days.
Initial download of the metrics may take a while.