Fig. 1
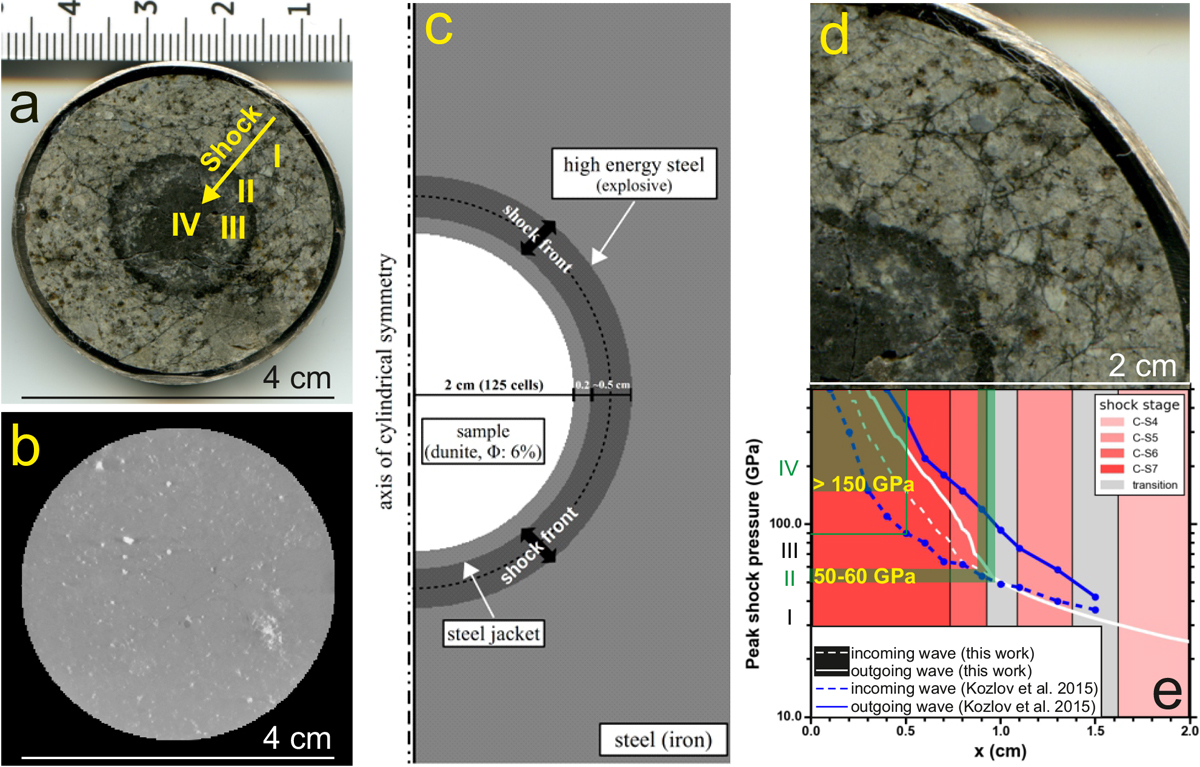
a: spherically shocked Chelyabinsk meteorite sample. The arrow outlines the direction of increasing shock. The roman numbers distinguish the four different shock zones. b: XMT snapshot showing apparent lack of large metal and troilite grains (seen in bright colors) in the central zone IV. c: set-up of the iSALE numerical model of the spherical shock-recovery experiment (Φ – porosity). d and e: comparison of the experiment result (d, zoomed upper-right quadrant of a) to the iSALE modeling results of the spherical shock experiment (e) with the shock stage intervals from Stoffler et al. (2018, 2019). The green areas in (e) outline the location of the shock-darkened zones II and IV, together with their pressure boundaries calculated from the inward shock wave peak shock pressures from our iSALE model. The blue-dashed and full lines correspond to inward and outward shock wave pressures from Kozlov et al. (2015). The corresponding lower zone IV boundary from the Kozlov et al. (2015) model is ~90 GPa as indicated by a green line.
Current usage metrics show cumulative count of Article Views (full-text article views including HTML views, PDF and ePub downloads, according to the available data) and Abstracts Views on Vision4Press platform.
Data correspond to usage on the plateform after 2015. The current usage metrics is available 48-96 hours after online publication and is updated daily on week days.
Initial download of the metrics may take a while.