Fig. 4.
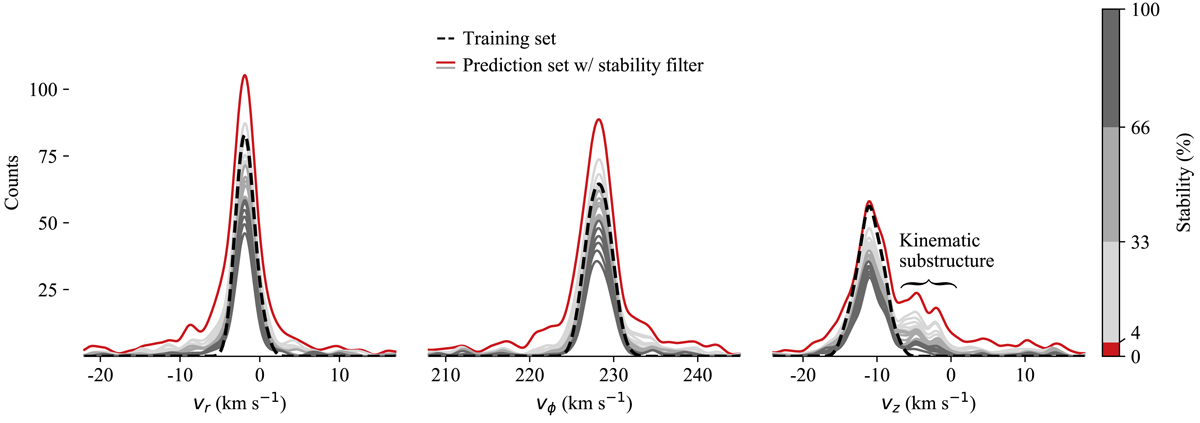
Kernel density estimation of marginal 3D velocity distributions for various stability filter criteria. The individual lines are color-coded by the filter criteria and range from red (stability < 4%) to dark blue, which represents the strictest filter criterion. The distributions are sampled at constant intervals in stability with a step size of 5%. The hue change from red to shades of blue indicates the transition from the contamination dominated to the more robust filter regime. In addition, we note a kinematic substructure in the z-velocity distribution which is indistinguishable from other sources in all features except vz.
Current usage metrics show cumulative count of Article Views (full-text article views including HTML views, PDF and ePub downloads, according to the available data) and Abstracts Views on Vision4Press platform.
Data correspond to usage on the plateform after 2015. The current usage metrics is available 48-96 hours after online publication and is updated daily on week days.
Initial download of the metrics may take a while.