Fig. 3.
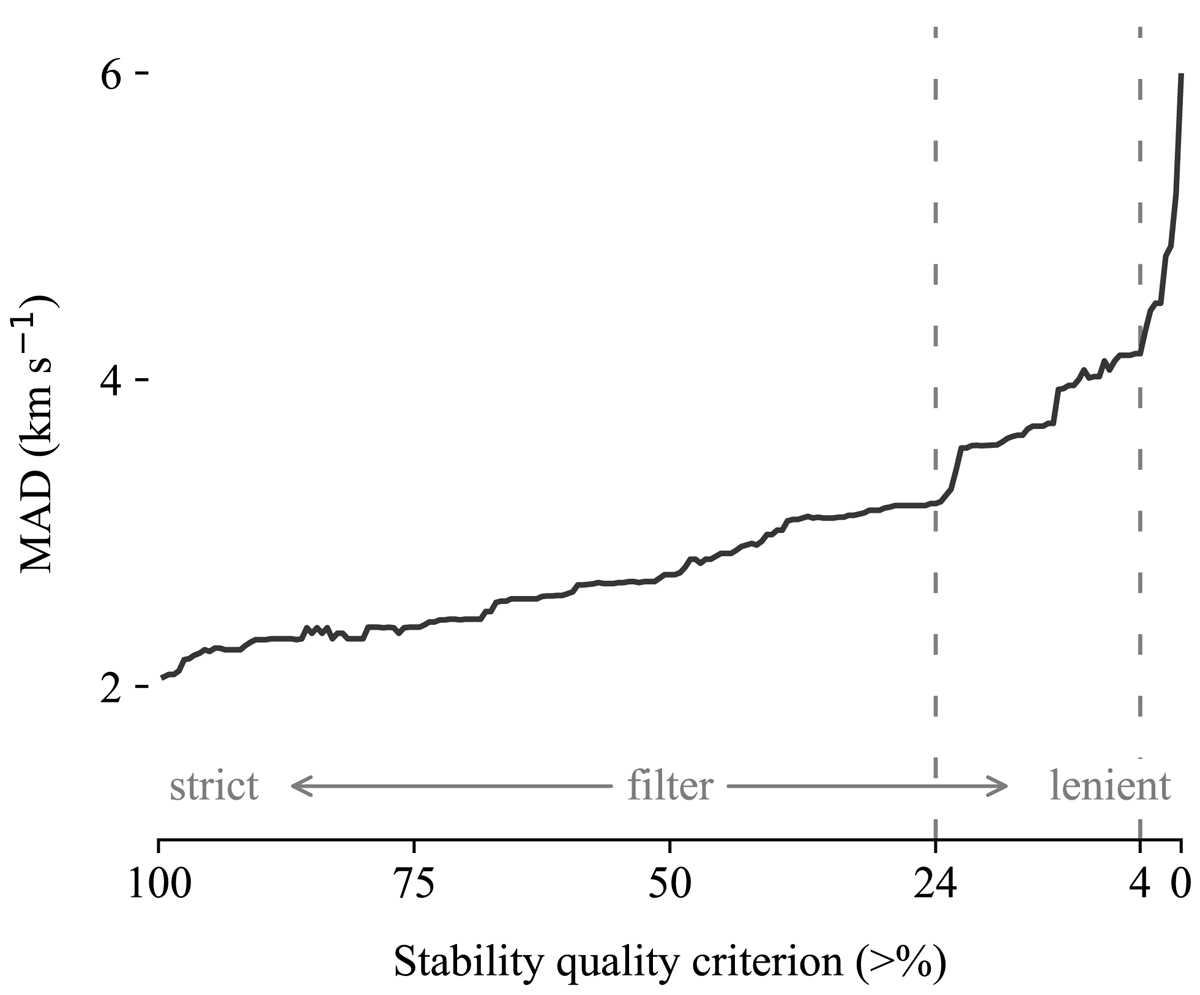
Median absolute deviation of sources from expected 3D velocity as a function of the stability quality filter. The x-axis is reversed displaying very strict filter criteria on the leftmost side and lenient filter criteria toward the right side. A trend is visible where the amount of scatter over the stability filter is split into two parts, where each is characterized by a different slope. Suitable quality filters are realized by stability > 4% and, more conservatively, stability > 24%.
Current usage metrics show cumulative count of Article Views (full-text article views including HTML views, PDF and ePub downloads, according to the available data) and Abstracts Views on Vision4Press platform.
Data correspond to usage on the plateform after 2015. The current usage metrics is available 48-96 hours after online publication and is updated daily on week days.
Initial download of the metrics may take a while.