Free Access
Fig. 7.
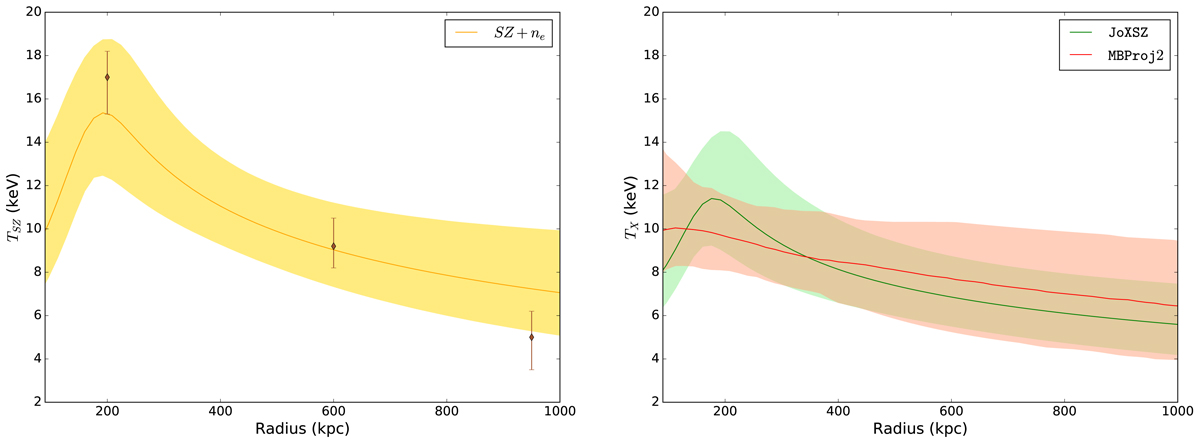
Comparison of CL J1226.9+3332 deprojected TSZ (left panel) and TX (right panel) temperature profiles (median with 95% interval). The restricted joint analysis is shown in yellow-orange. Green shows JoXSZ. Red shows the X-ray analysis alone. The posterior derived by Adam et al. (2015) is marked by points.
Current usage metrics show cumulative count of Article Views (full-text article views including HTML views, PDF and ePub downloads, according to the available data) and Abstracts Views on Vision4Press platform.
Data correspond to usage on the plateform after 2015. The current usage metrics is available 48-96 hours after online publication and is updated daily on week days.
Initial download of the metrics may take a while.