Fig. 9.
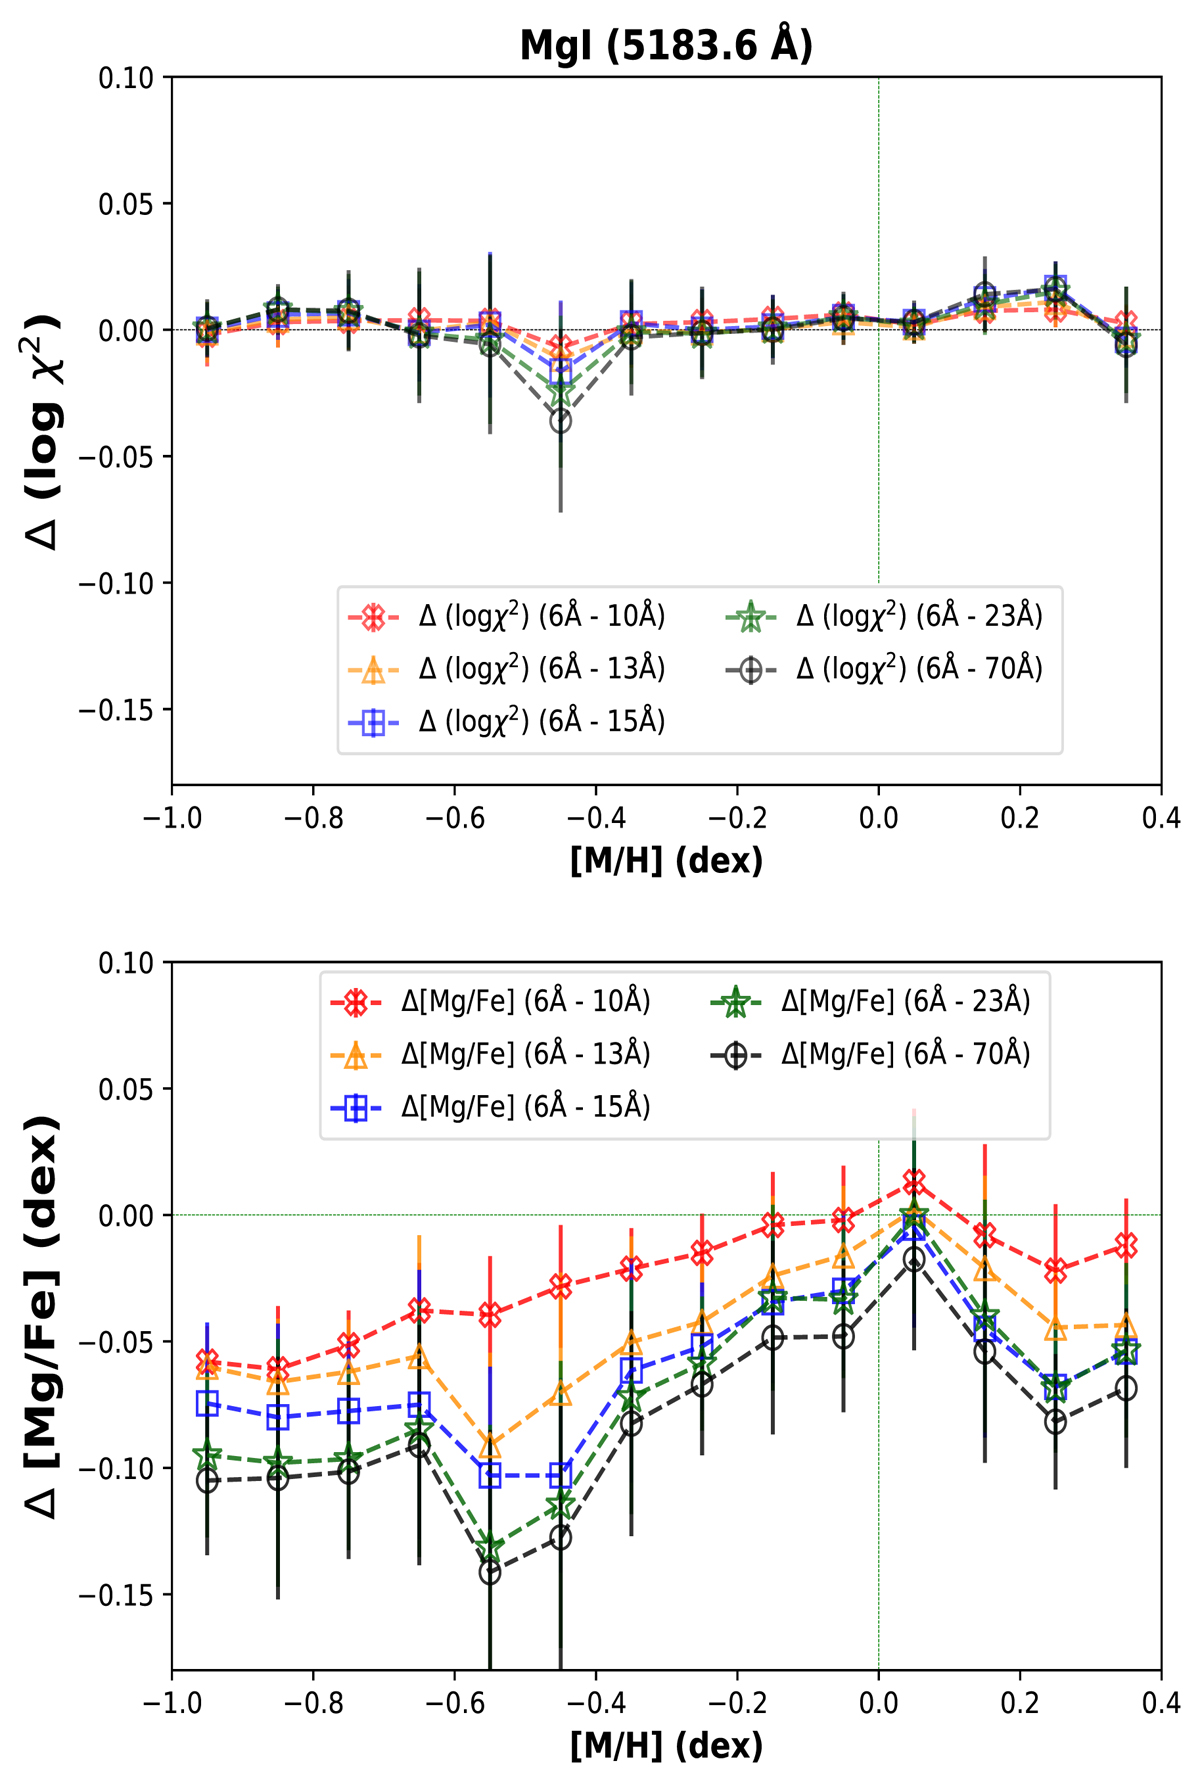
Analysis of strong saturated line 5183.6 Å. Top: comparison, averaged in metallicity bins of 0.1 dex, of the line χ2 fitting values (in logarithmic scale) for different local normalisation intervals (Δλnorm ∼ 6 Å, 10 Å, 13 Å, 15 Å, 23 Å, 70 Å; taking the shortest interval as a reference, which corresponds to two times the FWHM of the line in a solar-type star, approximately). Bottom: same analysis comparing the derived abundance values.
Current usage metrics show cumulative count of Article Views (full-text article views including HTML views, PDF and ePub downloads, according to the available data) and Abstracts Views on Vision4Press platform.
Data correspond to usage on the plateform after 2015. The current usage metrics is available 48-96 hours after online publication and is updated daily on week days.
Initial download of the metrics may take a while.