Fig. 8.
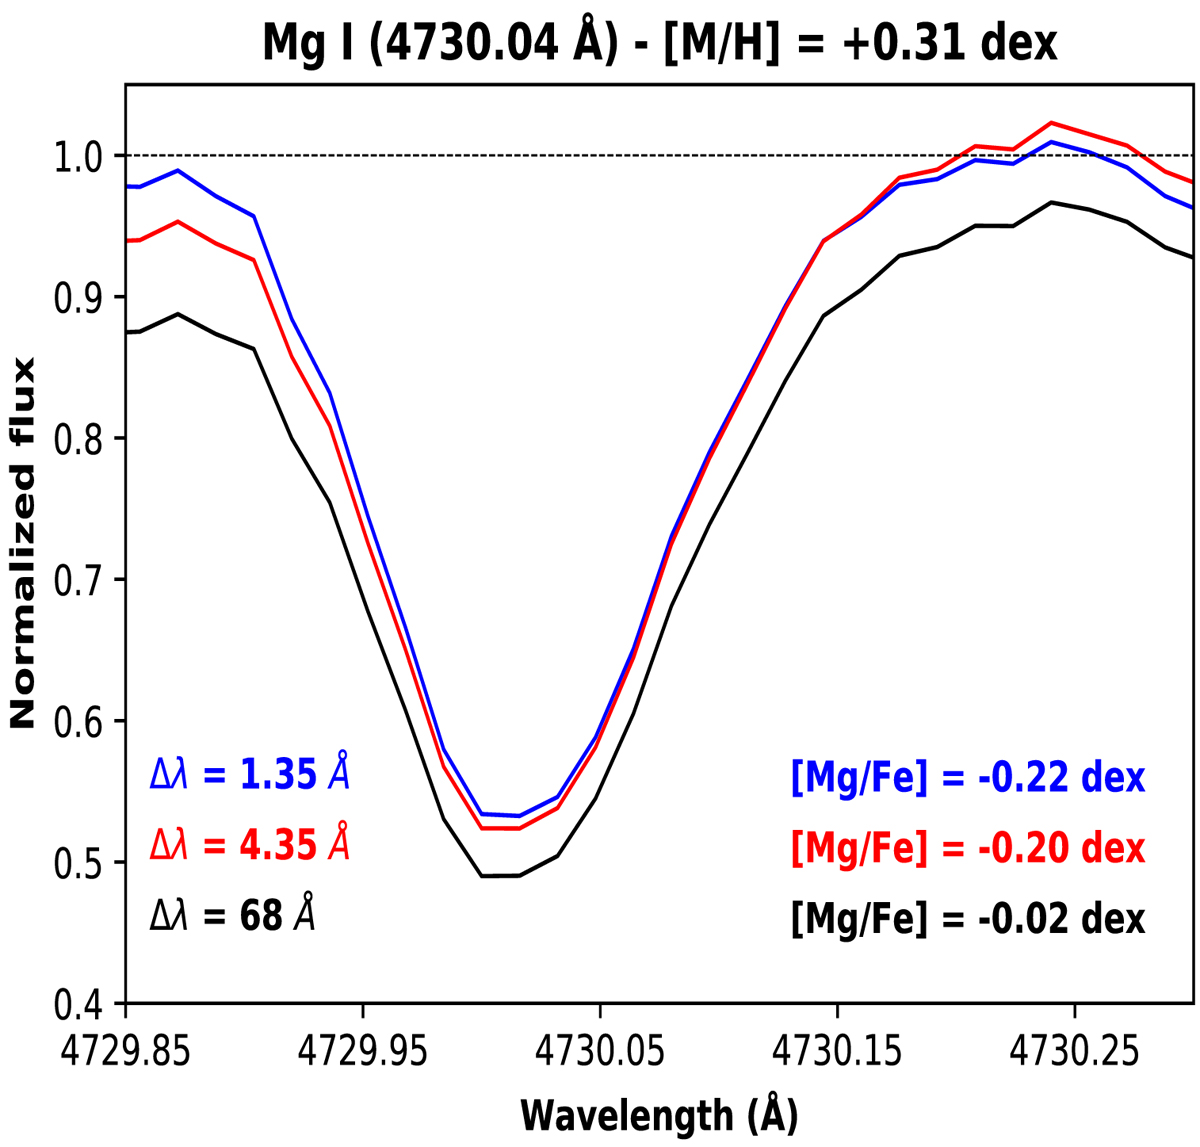
Normalised observed spectrum of a particular metal-rich star ([M/H] = +0.31 dex) in the abundance estimation window of the non-saturated line 4730.04 Å. Different line profile depending on the applied local continuum intervals (Δλnorm = 1.35 (blue), 4.35 (red), 68 Å (black)), along with the derived [Mg/Fe] abundance for each case.
Current usage metrics show cumulative count of Article Views (full-text article views including HTML views, PDF and ePub downloads, according to the available data) and Abstracts Views on Vision4Press platform.
Data correspond to usage on the plateform after 2015. The current usage metrics is available 48-96 hours after online publication and is updated daily on week days.
Initial download of the metrics may take a while.