Fig. 7.
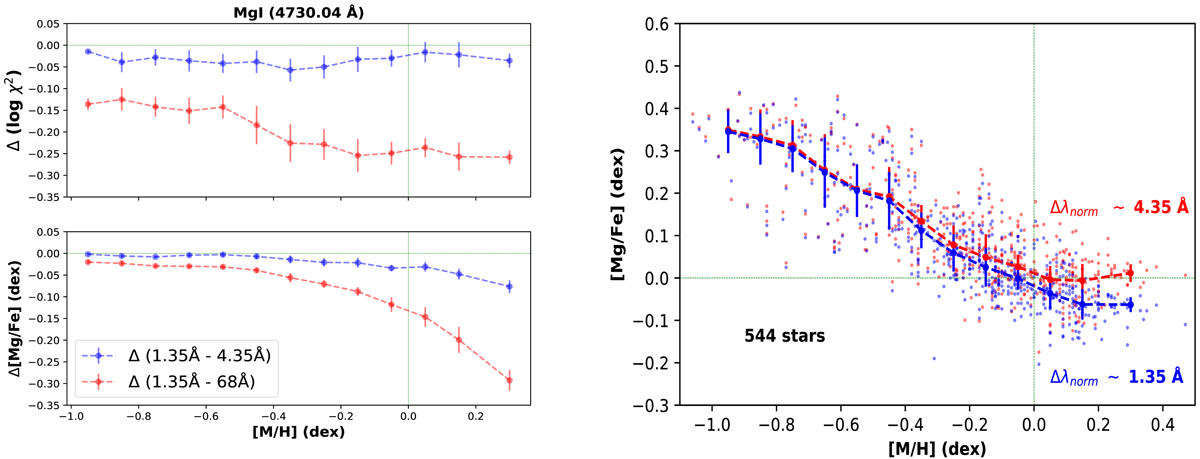
Analysis of the non-saturated line 4730.04 Å. Left: comparison, averaged in metallicity bins of 0.1 dex, of the line χ2 fitting in logarithmic scale (top) and the derived abundance (bottom) values from different local normalisation intervals (Δλnorm = 1.35, 4.35, 68 Å; taking the shortest interval as a reference, which corresponds to around four times the FWHM of the line in a solar-type star). Right: stellar abundance ratios [Mg/Fe] vs. [M/H] for the local normalisation window Δλnorm = 1.35 Å (blue points) and Δλnorm = 4.35 Å (red points). Their respective behaviours were calculated by the mean [Mg/Fe] abundance value per metallicity bin. The reduced number of stars is due to the cut in FWHMCCF for the non-saturated lines.
Current usage metrics show cumulative count of Article Views (full-text article views including HTML views, PDF and ePub downloads, according to the available data) and Abstracts Views on Vision4Press platform.
Data correspond to usage on the plateform after 2015. The current usage metrics is available 48-96 hours after online publication and is updated daily on week days.
Initial download of the metrics may take a while.