Fig. 4.
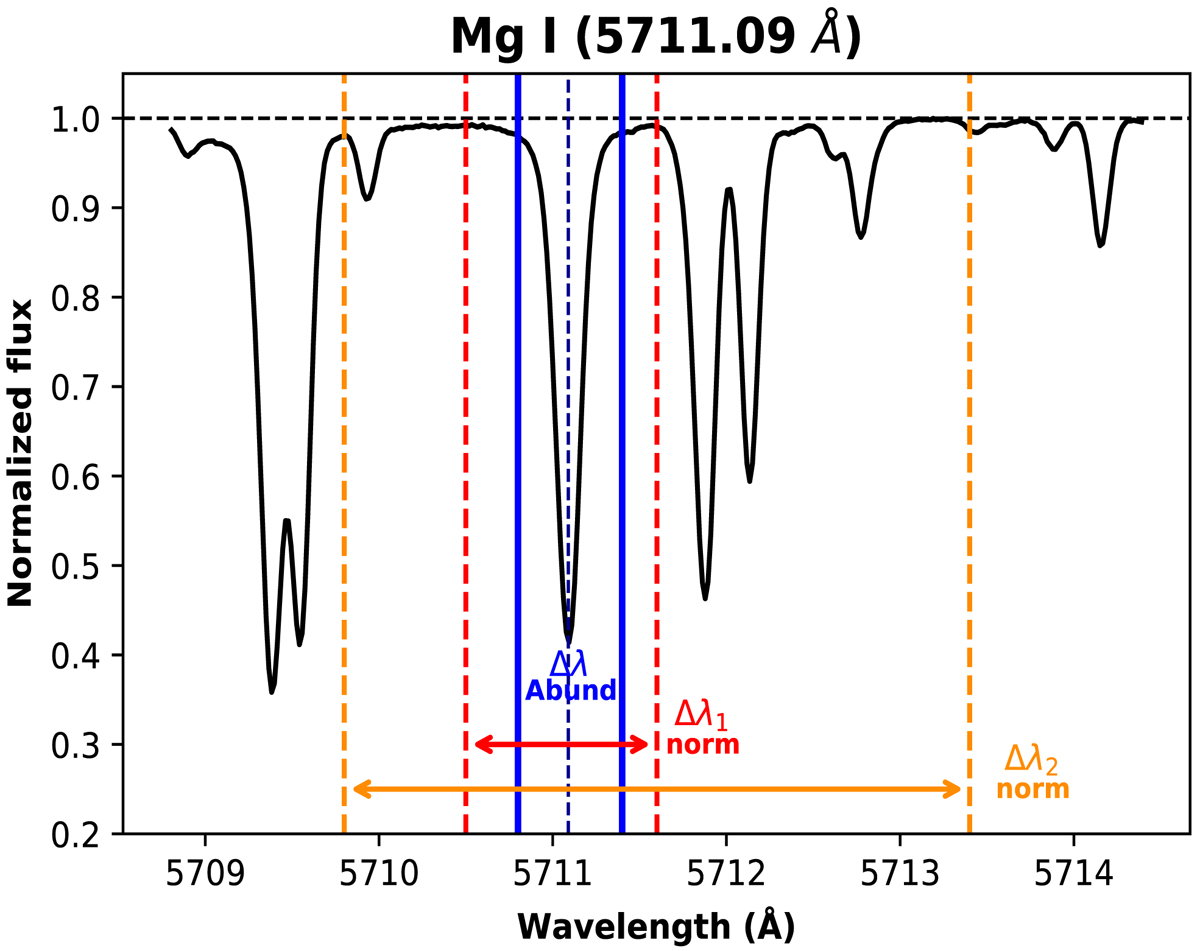
Observed solar spectrum from HARPS (R = 115 000, asteroid reflection) around the line 5711.09 Å. The adopted wavelength domain where the abundance is measured is delimited by blue vertical lines (ΔλAbund ∼ 0.5 Å). Two different local normalisation intervals of 1 Å (Δλ1) and 4 Å (Δλ2) are shown with red and orange dashed vertical lines, respectively.
Current usage metrics show cumulative count of Article Views (full-text article views including HTML views, PDF and ePub downloads, according to the available data) and Abstracts Views on Vision4Press platform.
Data correspond to usage on the plateform after 2015. The current usage metrics is available 48-96 hours after online publication and is updated daily on week days.
Initial download of the metrics may take a while.