Fig. B.1.
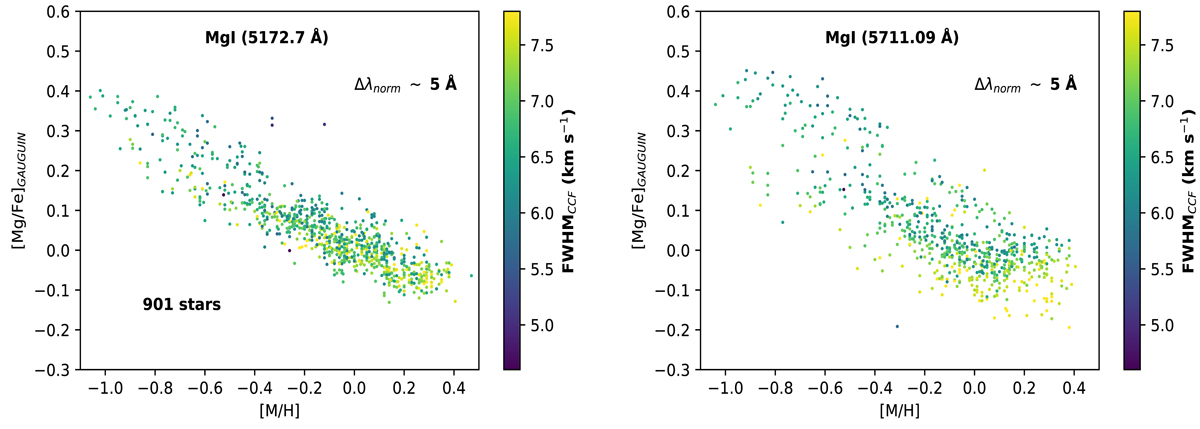
Abundance ratio [Mg/Fe] as a function of [M/H], colour-coded by the FWHMCCF of the cross-correlation function. Both panels contain the same number of stars. Strong saturated lines (left, with less dispersed sequences) are less sensitive to spectral line-broadening than non-saturated lines (right). The [Mg/Fe] abundances were derived by performing the continuum placement around a local wavelength interval of 5 Å.
Current usage metrics show cumulative count of Article Views (full-text article views including HTML views, PDF and ePub downloads, according to the available data) and Abstracts Views on Vision4Press platform.
Data correspond to usage on the plateform after 2015. The current usage metrics is available 48-96 hours after online publication and is updated daily on week days.
Initial download of the metrics may take a while.