Fig. A.1.
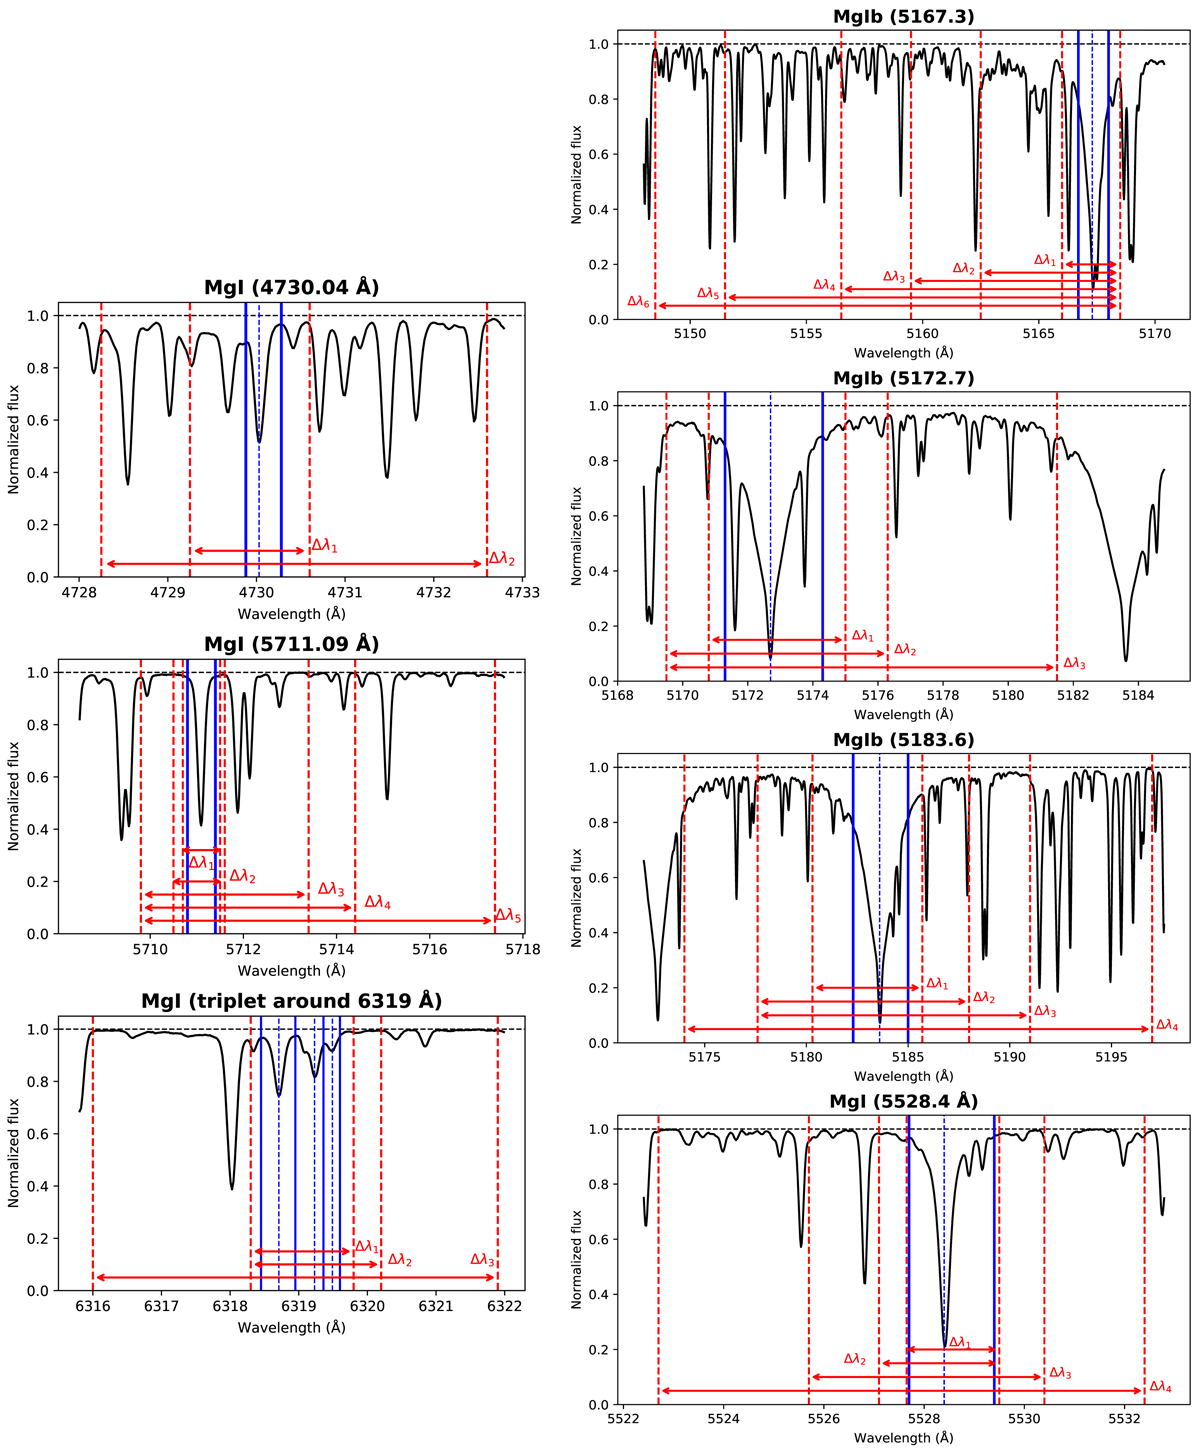
Observed solar spectrum from HARPS around each Mg I spectral line. The abundance estimation window is delimited by blue vertical lines (ΔλAbund ∼ 0.5 Å for non-saturated lines and ΔλAbund ∼ 2.5 Å for strong saturated ones). The different local normalisation intervals applied in the analysis are shown with red dashed vertical lines. Left: non-saturated lines: 4730.04, 5711.09, 6318.7, 6319.24, and 6319.49 Å. Right: strong saturated lines: 5167.3, 5172.7, 5183.6, and 5528.4 Å (from top to bottom).
Current usage metrics show cumulative count of Article Views (full-text article views including HTML views, PDF and ePub downloads, according to the available data) and Abstracts Views on Vision4Press platform.
Data correspond to usage on the plateform after 2015. The current usage metrics is available 48-96 hours after online publication and is updated daily on week days.
Initial download of the metrics may take a while.