Fig. 15.
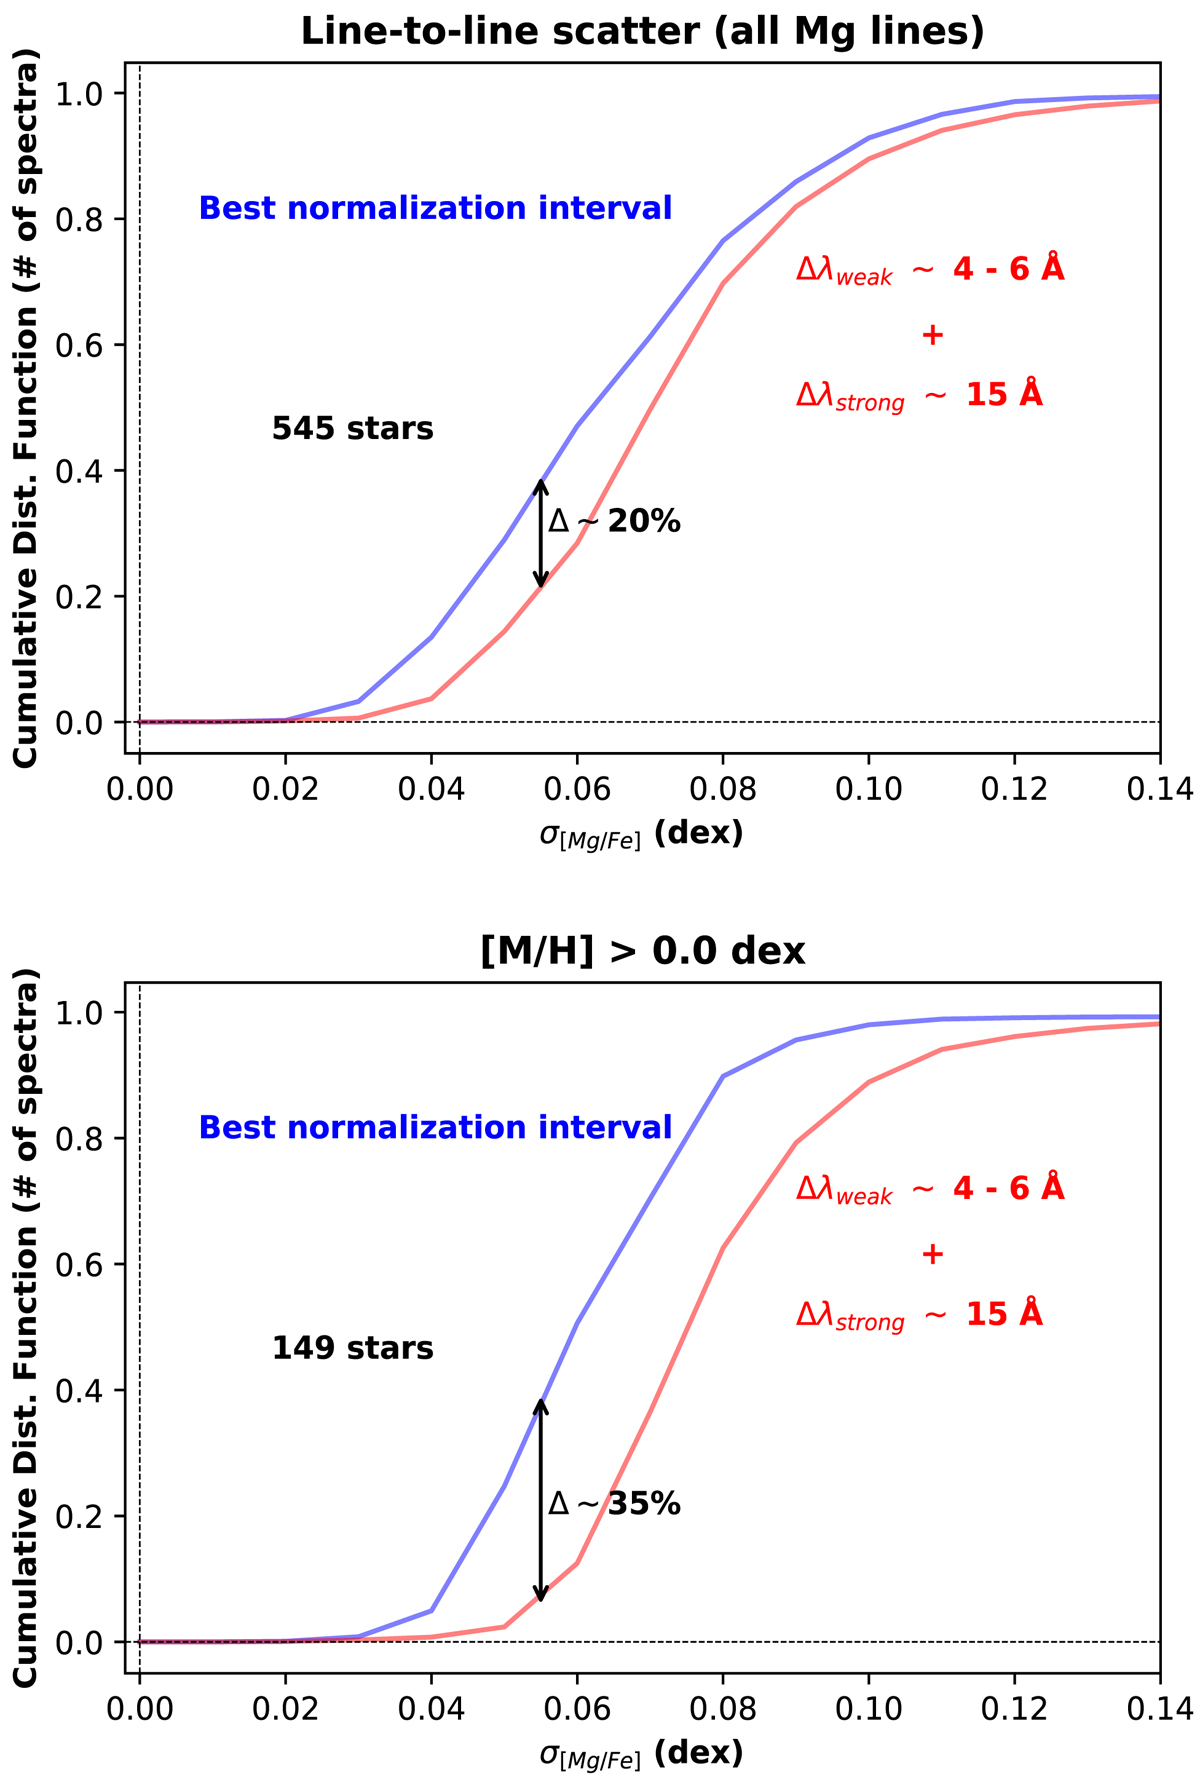
Top: cumulative distribution function of the line-to-line scatter estimation of the derived [Mg/Fe] abundance ratio for the spectra sample for which all the Mg lines are taken into account. Bottom: same but for the metal-rich sample ([M/H] > 0.0 dex). The red curve corresponds to the typical normalisation windows used in the literature, while the blue curve shows the results with our optimised normalisation procedure.
Current usage metrics show cumulative count of Article Views (full-text article views including HTML views, PDF and ePub downloads, according to the available data) and Abstracts Views on Vision4Press platform.
Data correspond to usage on the plateform after 2015. The current usage metrics is available 48-96 hours after online publication and is updated daily on week days.
Initial download of the metrics may take a while.