Fig. 14.
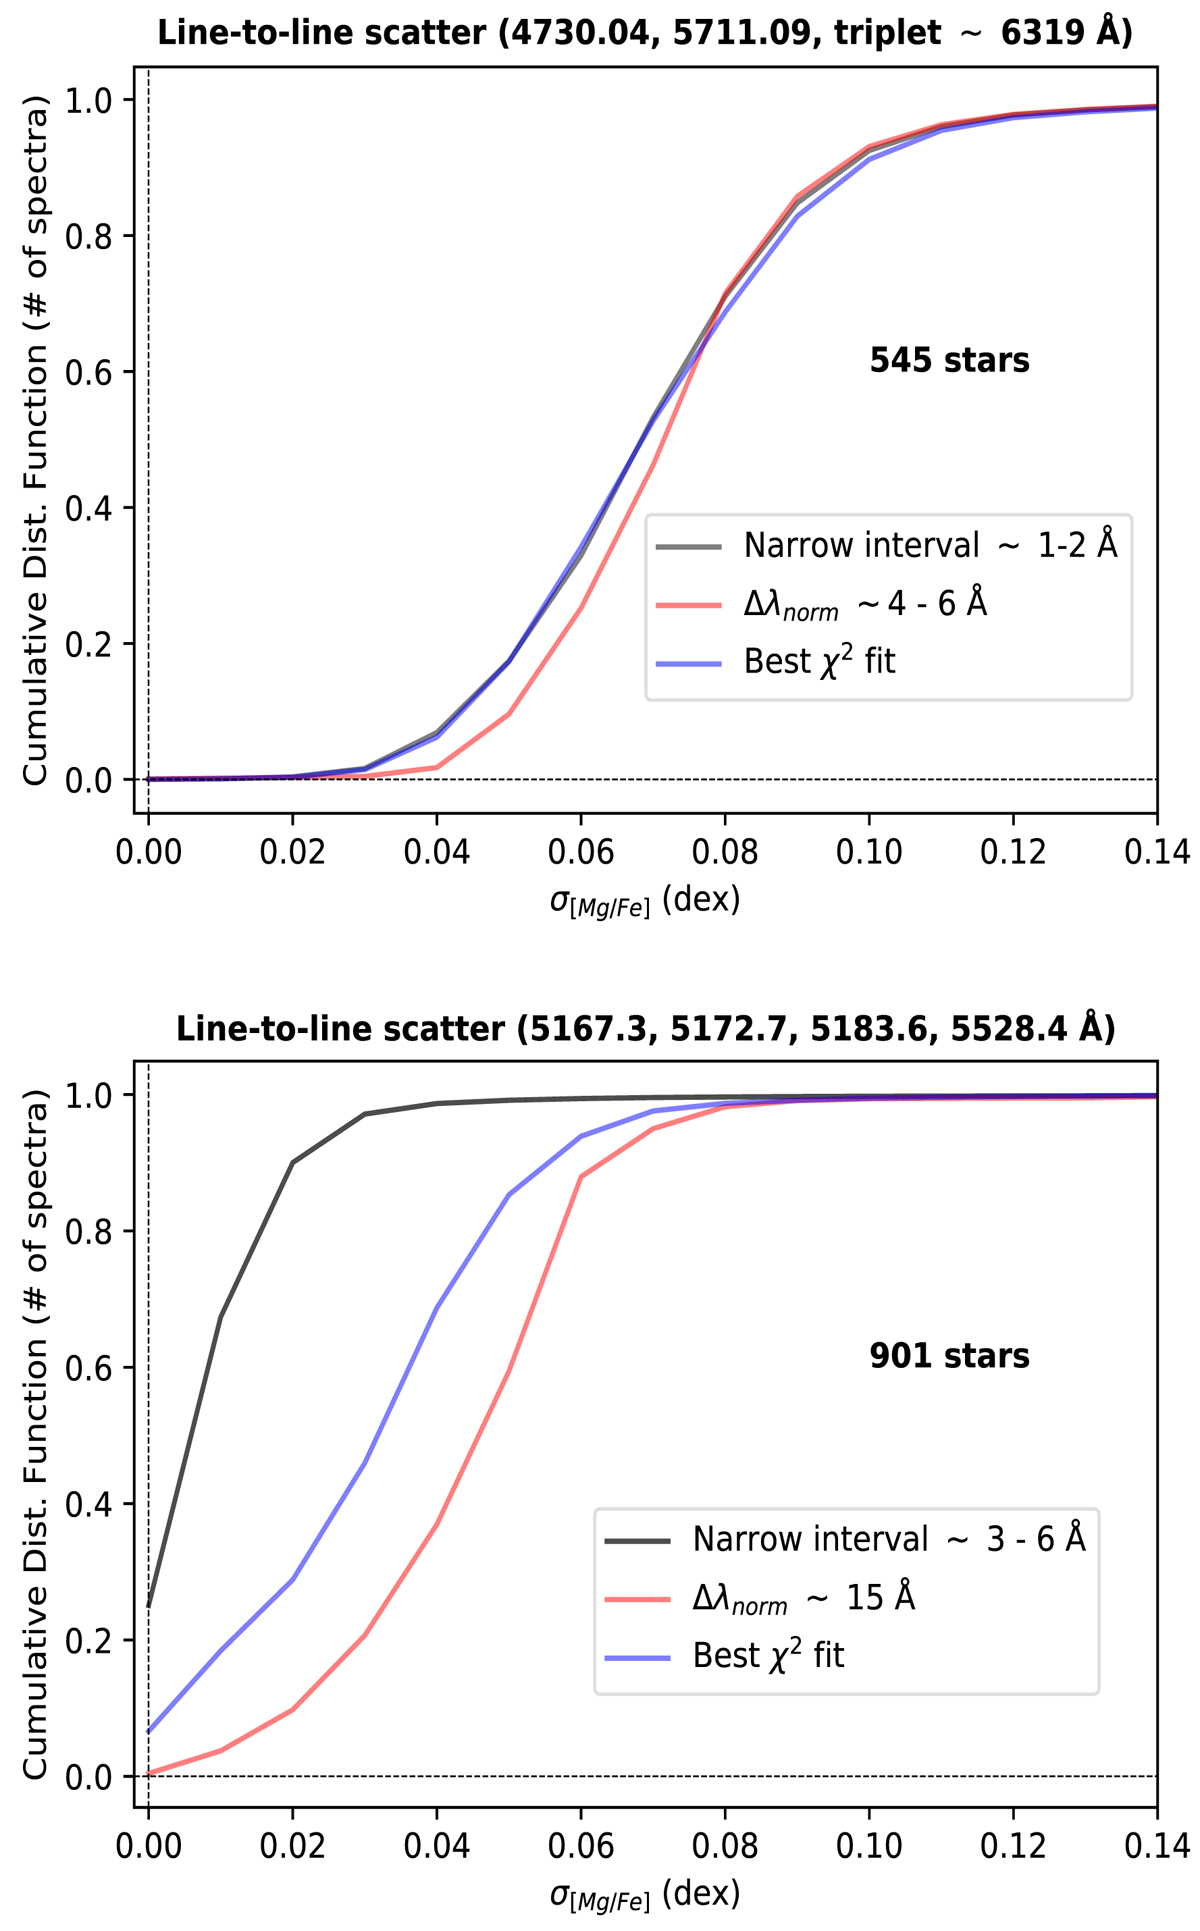
Cumulative distribution function of the line-to-line scatter estimation of the derived [Mg/Fe] abundances per spectrum, for weak non-saturated Mg lines (top; 4730.04, 5711.09, 6318.7, 6319.24, and 6319.49 Å) and strong saturated ones (bottom; 5167.3, 5172.7, 5183.6, and 5528.4 Å) separately. The blue curve describes the values that correspond to the normalisation interval that presents the lowest χ2 fitting value, the red one corresponds to the continuum placement performance in the typical wavelength interval used in previous works in the literature, and the black curve corresponds to a narrower local normalisation interval around each line as proposed in this work.
Current usage metrics show cumulative count of Article Views (full-text article views including HTML views, PDF and ePub downloads, according to the available data) and Abstracts Views on Vision4Press platform.
Data correspond to usage on the plateform after 2015. The current usage metrics is available 48-96 hours after online publication and is updated daily on week days.
Initial download of the metrics may take a while.