Fig. 11.
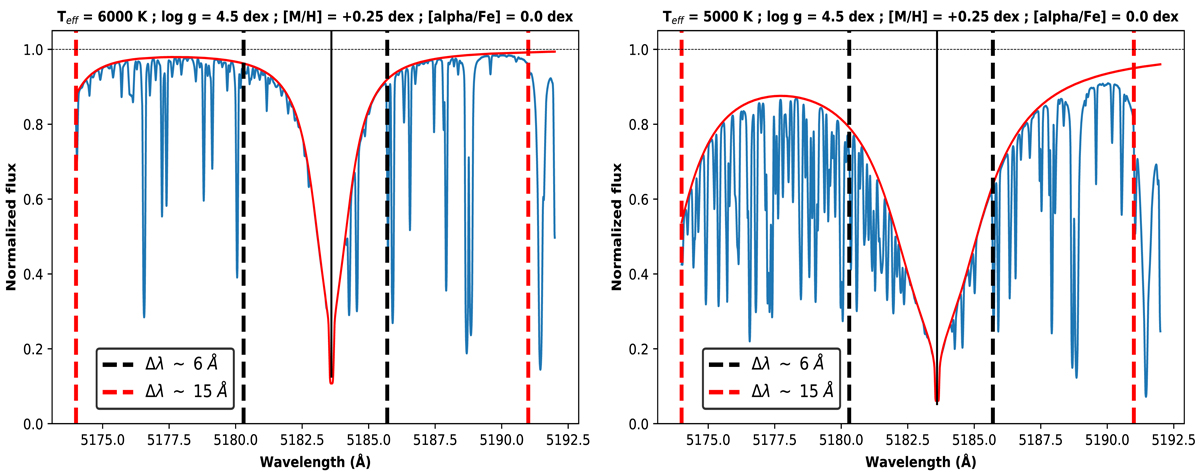
Comparison of synthetic spectra around the saturated line 5183.6 Å (black solid vertical line), considering all the absorption lines (blue spectra) and only the Mg line absorption (red spectra). The black and red dashed vertical lines present the limits of the 6 Å and 15 Å normalisation windows, respectively. Left: hot star (Teff = 6000 K). Right: cool star (Teff = 5000 K). The other atmospheric parameters are constant (log g = 4.5 dex, [M/H] = +0.25 dex, [α/Fe] = 0.0 dex).
Current usage metrics show cumulative count of Article Views (full-text article views including HTML views, PDF and ePub downloads, according to the available data) and Abstracts Views on Vision4Press platform.
Data correspond to usage on the plateform after 2015. The current usage metrics is available 48-96 hours after online publication and is updated daily on week days.
Initial download of the metrics may take a while.