Fig. 10.
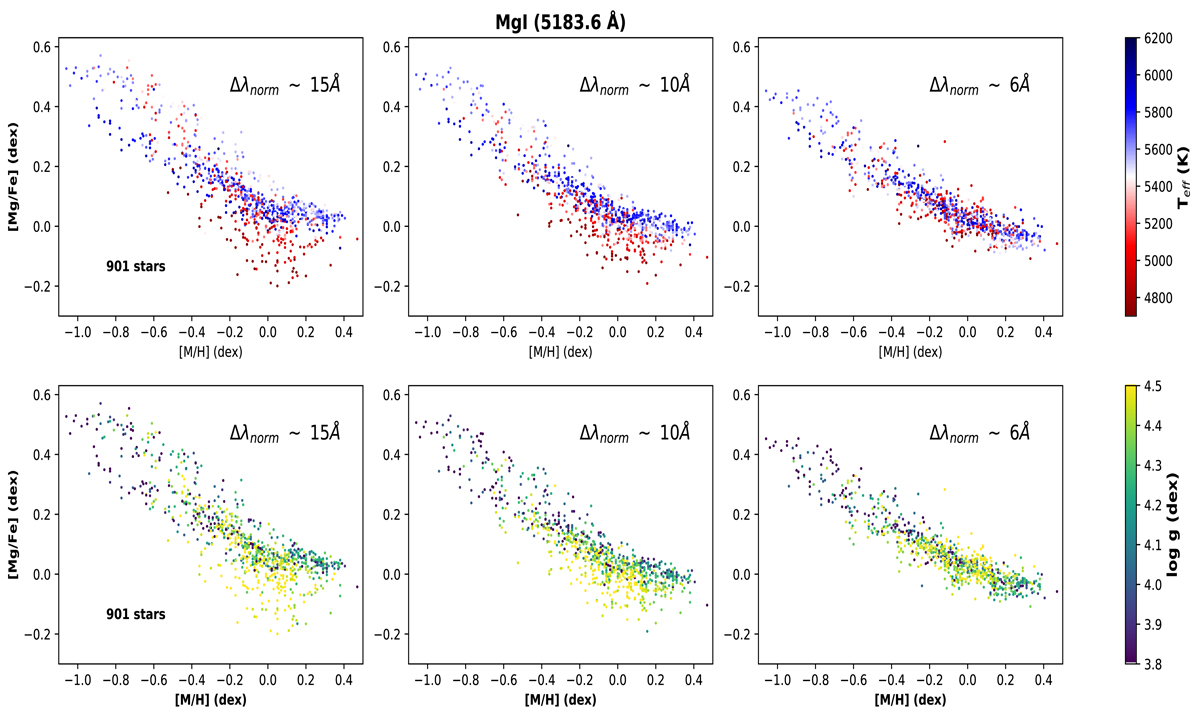
Comparison of stellar abundance ratios [Mg/Fe] vs. [M/H] derived for the strong saturated line 5183.6 Å, colour-coded by stellar effective temperature (top row) and surface gravity (bottom row), after carrying out the continuum placement in three different local normalisation intervals around the line. Left:Δλnorm ∼ 15 Å, typical local continuum interval applied in the literature for strong lines. Middle:Δλnorm ∼ 10 Å. Right:Δλnorm ∼ 6 Å, narrow normalisation interval (∼ twice the FWHM of the line in solar-type stars).
Current usage metrics show cumulative count of Article Views (full-text article views including HTML views, PDF and ePub downloads, according to the available data) and Abstracts Views on Vision4Press platform.
Data correspond to usage on the plateform after 2015. The current usage metrics is available 48-96 hours after online publication and is updated daily on week days.
Initial download of the metrics may take a while.