Fig. A.10.
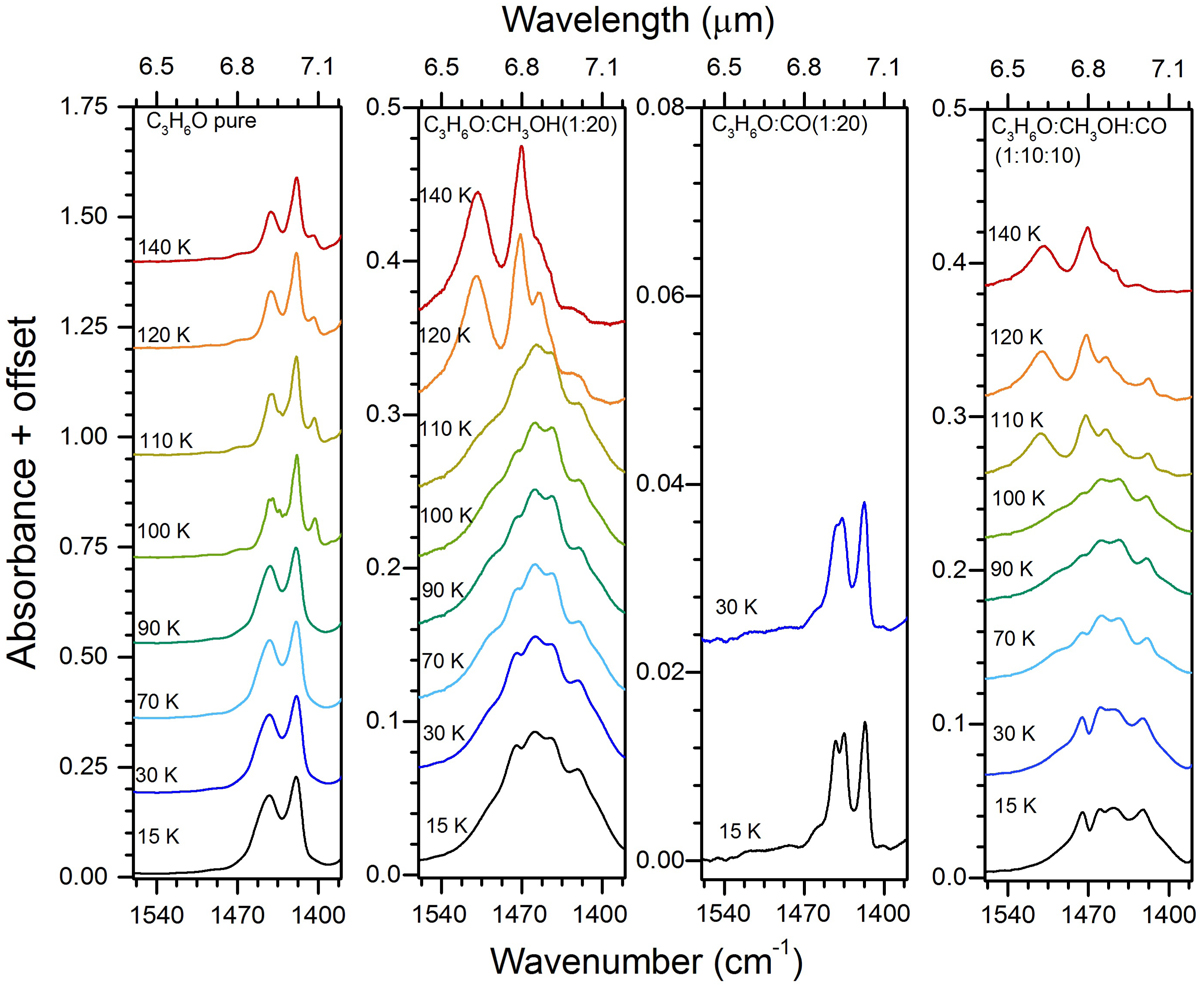
infrared spectra in the range of 1550–1390 cm−1 (6.45–7.19 μm) showing the CH3 asymmetric deformation band of acetone embedded in different ice mixtures, from left to right: pure CH3COCH3, CH3COCH3:CH3OH(1:20), CH3COCH3:CO(1:20), and CH3COCH3:CH3OH:CO(1:10:10). The spectra at different temperatures are offset for improved visualization. Since the FWHM of the CH3 asymmetric deformation band was not measured in the methanol-containing mixtures (due to the overlap with the methanol CH3 bending mode), the peak position vs. FWHM plot for this acetone feature in CO matrix is displayed with the data in Fig. A.9.
Current usage metrics show cumulative count of Article Views (full-text article views including HTML views, PDF and ePub downloads, according to the available data) and Abstracts Views on Vision4Press platform.
Data correspond to usage on the plateform after 2015. The current usage metrics is available 48-96 hours after online publication and is updated daily on week days.
Initial download of the metrics may take a while.