Fig. A.8.
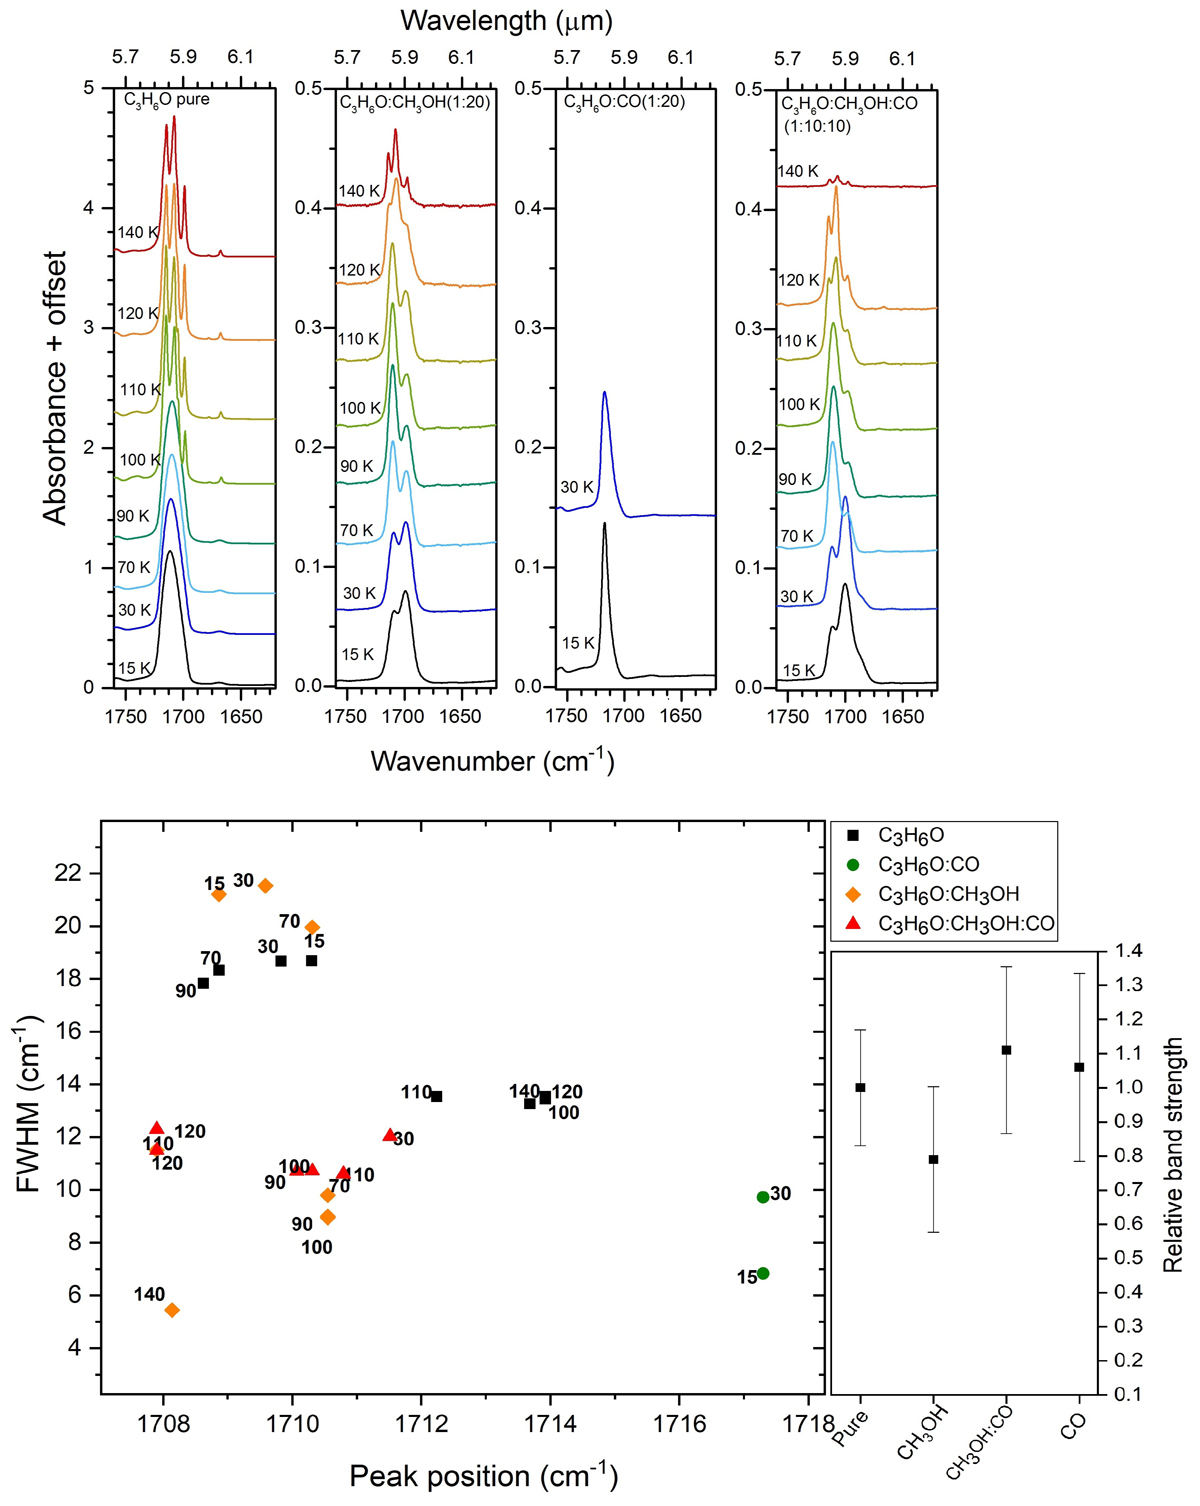
Upper panel: infrared spectra in the range of 1760–1630 cm−1 (5.68–6.13 μm) showing the C=O stretch band of acetone embedded in different ice mixtures, from left to right: pure CH3COCH3, CH3COCH3:CH3OH(1:20), CH3COCH3:CO(1:20), and CH3COCH3:CH3OH:CO(1:10:10). The spectra at different temperatures are offset for improved visualization. Bottom left: peak position vs. FWHM plot for the C=O stretch band in different ice matrices, represented by the different colors, and for different temperatures, indicated by the numbers in the graph. Bottom right: apparent band strength for the acetone C=O stretch band at 15 K in the various matrices with respect to the band strength for pure acetone from Hudson et al. (2018).
Current usage metrics show cumulative count of Article Views (full-text article views including HTML views, PDF and ePub downloads, according to the available data) and Abstracts Views on Vision4Press platform.
Data correspond to usage on the plateform after 2015. The current usage metrics is available 48-96 hours after online publication and is updated daily on week days.
Initial download of the metrics may take a while.