Fig. 9
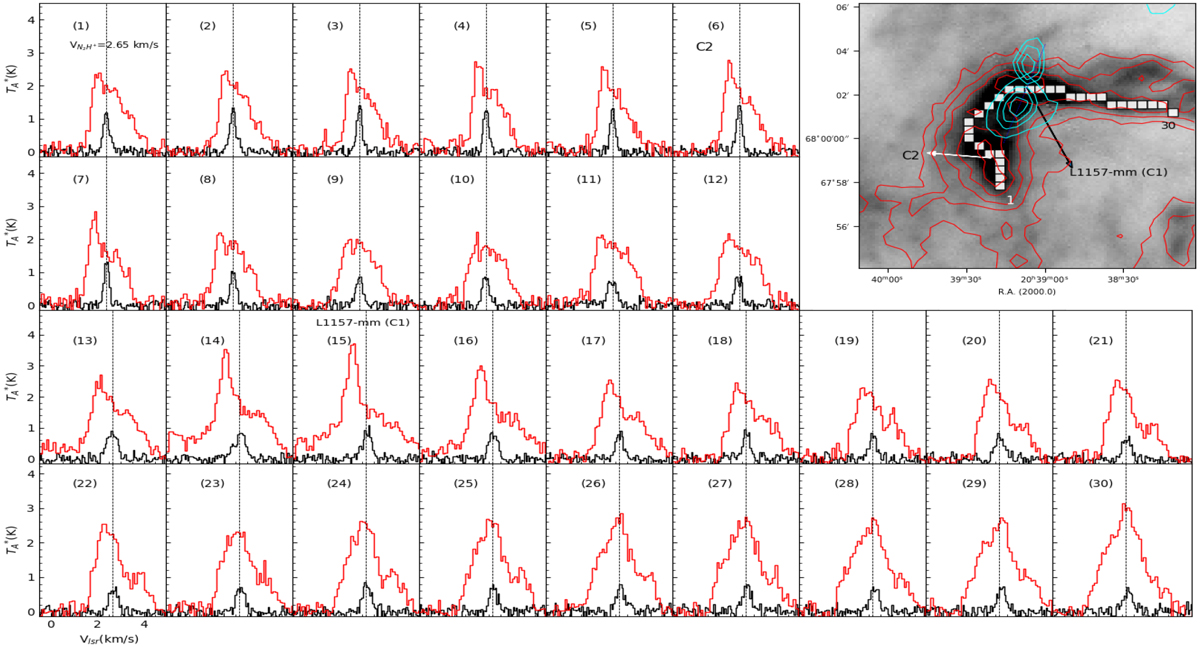
Distribution of the C18O (black) and 12CO (red) (1–0) line along the positions of the Filfinder skeleton. The dotted line shows the vlsr of the cloud, which is adopted from the N2H+ peak velocity. The spatial positions of the profiles are shown with filled white boxes in the 250 μm Herschel image (upper right corner) from 1–30, starting from extreme south toward the west along the filament. The protostar L1157-mm and clump C2 are marked by black and white arrows, respectively. The integrated intensity contours of C18 O (1–0) shown in red are obtained by summing the flux over velocity intervals from 2.2–3.0 km s−1. The contours start from 6σ with intervals of 4σ, where σ ~ 0.019 K km s−1. The cyancontours show the blueshifted (toward the north) and redshifted lobe (towards the south) of the bipolar outflow. The levels for the blueshifted lobe range from 0.12–0.5 in steps of 0.08 K km s−1, and for the redshifted lobe, they are in range of 3.9–6.9 K km s−1 in intervals of 1 K km s−1. The 12CO line was integrated from −2.2 to +2.3 km s−1 for the high-velocity wings in the southern lobe and from 3.0 to 3.9 km s−1 in the northern lobe.
Current usage metrics show cumulative count of Article Views (full-text article views including HTML views, PDF and ePub downloads, according to the available data) and Abstracts Views on Vision4Press platform.
Data correspond to usage on the plateform after 2015. The current usage metrics is available 48-96 hours after online publication and is updated daily on week days.
Initial download of the metrics may take a while.