Fig. 8
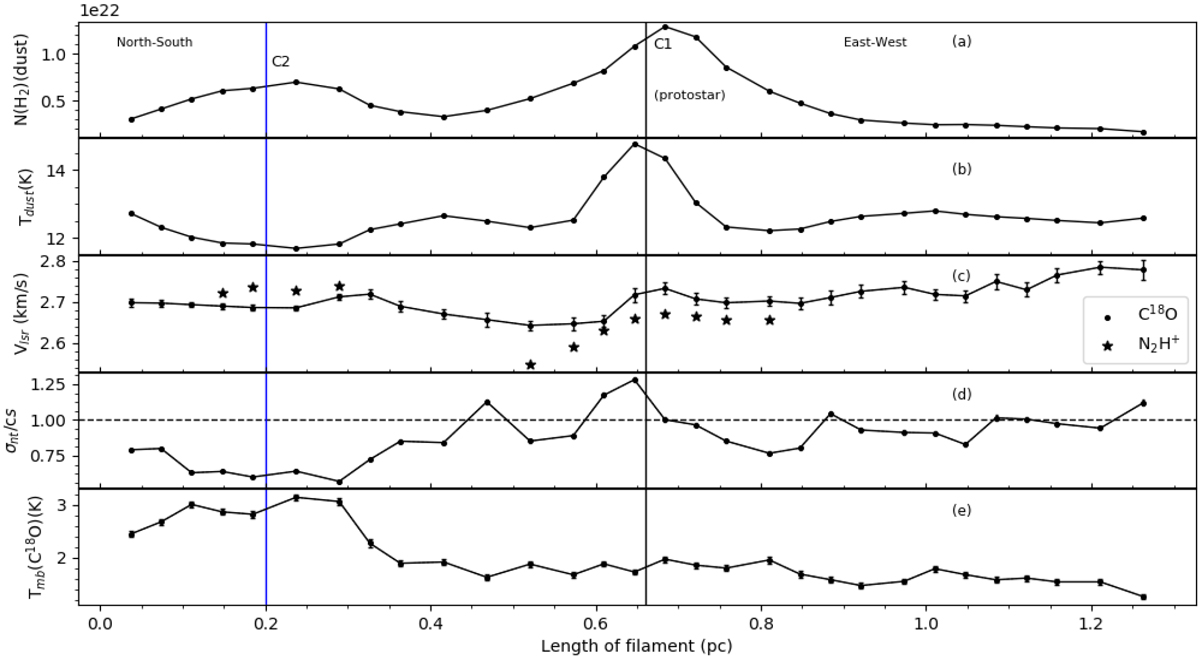
Results of C18O (1–0) and dust emission analysis along the cloud filament length. (a) Hydrogen column density derived using Herschel PACS and SPIRE images. (b) Dust temperatures. (c) Centroid velocity of C18 O obtained from Gaussian fitting of profiles (filled dots). The centroid velocities obtained using hyperfine fitting of the N2H+ (1–0) line coinciding with the positions along the filament are marked by filled stars. (d) Mach number, which is the ratio of the nonthermal velocity dispersion (σnt) along the line of sight and the isothermal sound speed (cs) at 10 K (~0.19 km s−1). The blue line at 0.2 pc and the black line at 0.65 pc show the position of clump C2 and theclass 0 protostar L1157-mm, respectively. (e) Main-beam brightness temperature using C18 O lines.
Current usage metrics show cumulative count of Article Views (full-text article views including HTML views, PDF and ePub downloads, according to the available data) and Abstracts Views on Vision4Press platform.
Data correspond to usage on the plateform after 2015. The current usage metrics is available 48-96 hours after online publication and is updated daily on week days.
Initial download of the metrics may take a while.