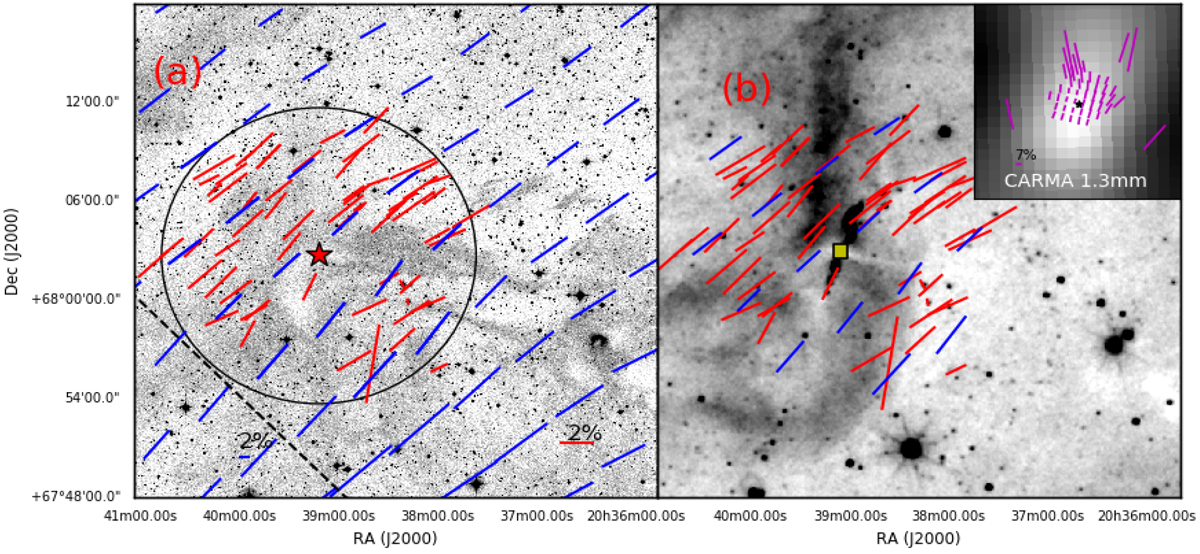
Fig. 7

(a) Optical polarization vectors (in red) overplotted on the 0.5° × 0.5° DSS image. The dashed line shows the direction of the Galactic plane. The circle shows the region of optical polarization observations. Planck polarization vectors are shown in blue (inside and outside the circle). (b) WISE 12 μm image for the same region in inverted scale. Optical (in red) and Planck (in blue) polarization vectors are overlaid. The yellow box around the location of the protostar marks the region of submillimeter polarization observations observed in wavelength 1.3 mm using CARMA (Hull et al. 2013), and the vectors are shown in the inset (upper right corner) in magenta. The location of the protostar in the inset is identified by the black star.
Current usage metrics show cumulative count of Article Views (full-text article views including HTML views, PDF and ePub downloads, according to the available data) and Abstracts Views on Vision4Press platform.
Data correspond to usage on the plateform after 2015. The current usage metrics is available 48-96 hours after online publication and is updated daily on week days.
Initial download of the metrics may take a while.


