Fig. 5
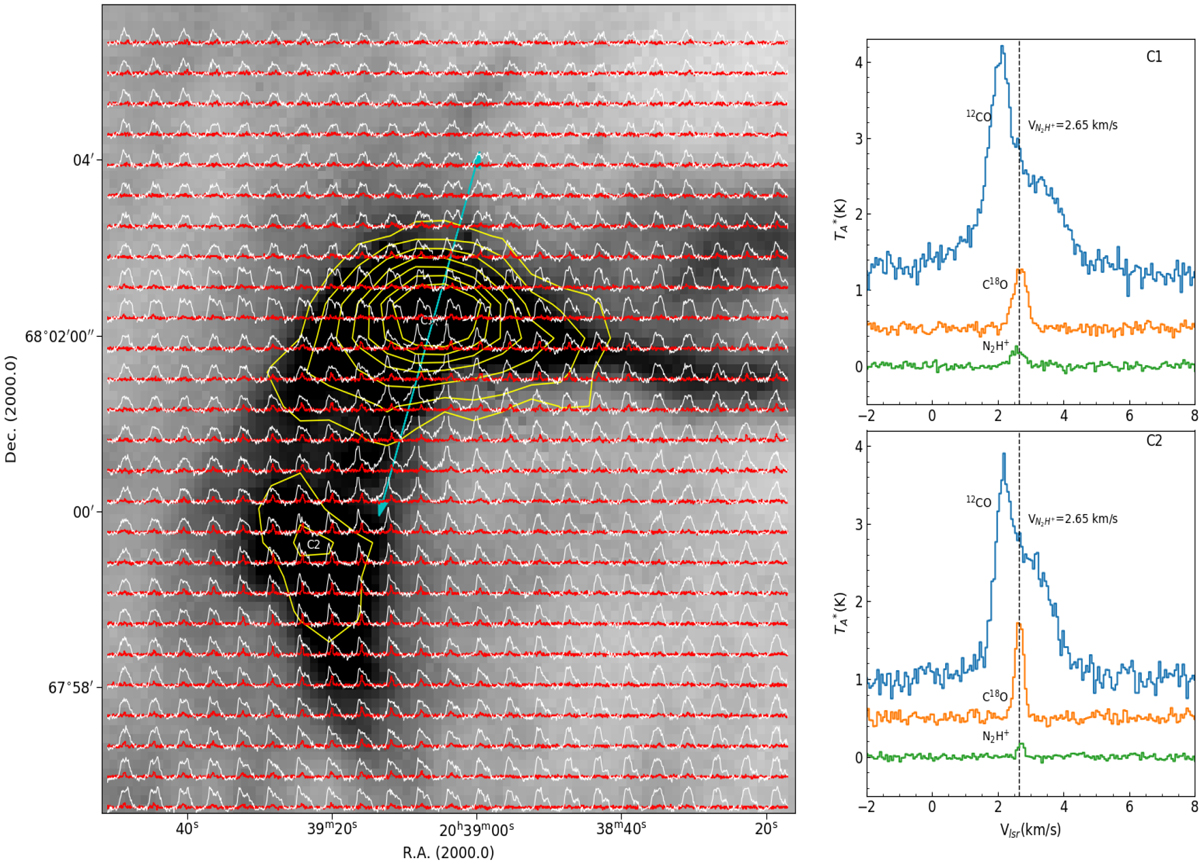
Distribution of 12CO (white) and C18O (red) profilesover the 9′ × 9′ region. In the left-hand panel, the background image is the Herschel 250 μm emission for cloud L1157, on which we overlay contours of the N2H+ (1–0) line in yellow. The positions of core C1 and clump C2 are marked in white. The extent of the outflow is marked by the cyan arrow. Contour levels start from 4σ in steps of 3σ, where σ ~ 0.05 K km s−1. The small windows in the right-hand panel show the average spectra of the 12CO, C18 O, and N2H+ (1–0) (isolated component) lines for C1 (top) and C2 (bottom). The average was taken over the half-maximum contour of the intensity map of the N2H+ emission for C1 and C2. The dashed line indicates the velocity of N2H+ obtained from the Gaussian hyperfine fitting of its seven hyperfine components.
Current usage metrics show cumulative count of Article Views (full-text article views including HTML views, PDF and ePub downloads, according to the available data) and Abstracts Views on Vision4Press platform.
Data correspond to usage on the plateform after 2015. The current usage metrics is available 48-96 hours after online publication and is updated daily on week days.
Initial download of the metrics may take a while.