Fig. 4
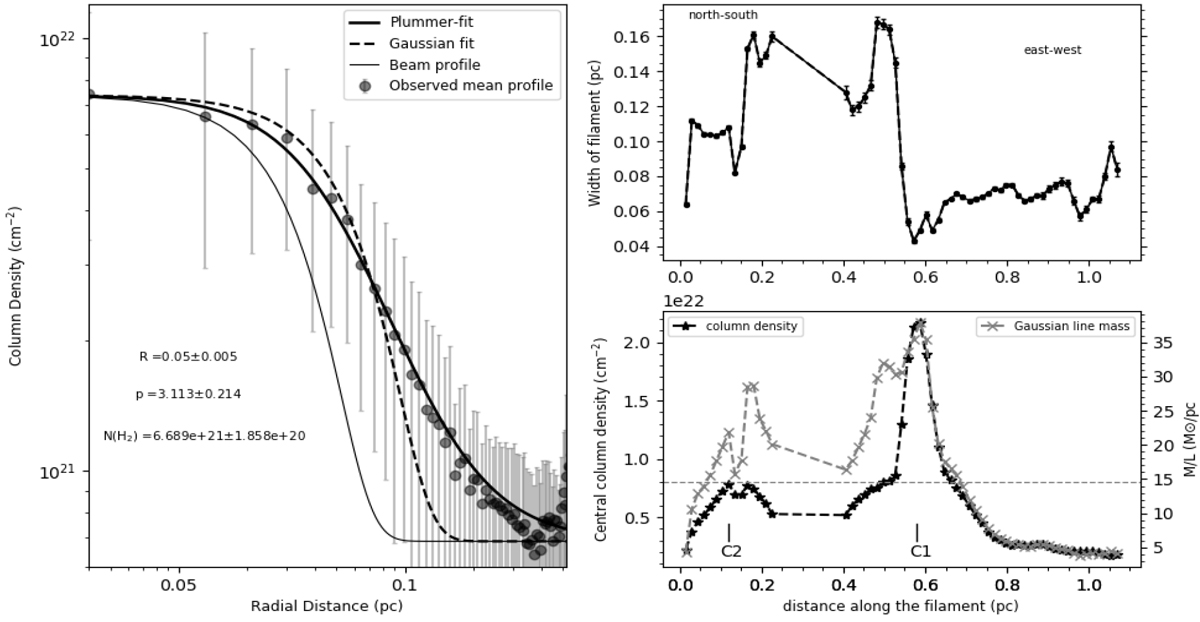
Left panel: mean radial column density profile of the L1157 filament (gray points) measured perpendicular to the crest of filament shown in Fig. 1. The gray error bars mark the ± 1σ dispersion of the distribution of radial profiles along the spine of the filament. The solid black curve shows the best-fit Plummer model fitted on the mean radial profile. The black dashed curve marks the best-fit Gaussian function to the inner radius of the profile. The thin solid black curve represents the Gaussian profile of the beam. Right upper panel: deconvolved Gaussian FWHM of the L1157 filament as a function of position along the crest of the filament (starting from southern core toward the central protostar). Right lower panel: the central column density along the crest of the filament obtained from the best-fit Plummer model is plotted as the dashed black line. Background-subtracted mass-per-unit length calculated from the Gaussian fit (dashed gray line). The dashed gray horizontal line indicates the critical mass-per-unit length or line mass of an isothermal filament in equilibrium as 2c![]() /G
~ 15
M⊙ pc−1 at 10 K.
/G
~ 15
M⊙ pc−1 at 10 K.
Current usage metrics show cumulative count of Article Views (full-text article views including HTML views, PDF and ePub downloads, according to the available data) and Abstracts Views on Vision4Press platform.
Data correspond to usage on the plateform after 2015. The current usage metrics is available 48-96 hours after online publication and is updated daily on week days.
Initial download of the metrics may take a while.