Fig. 10
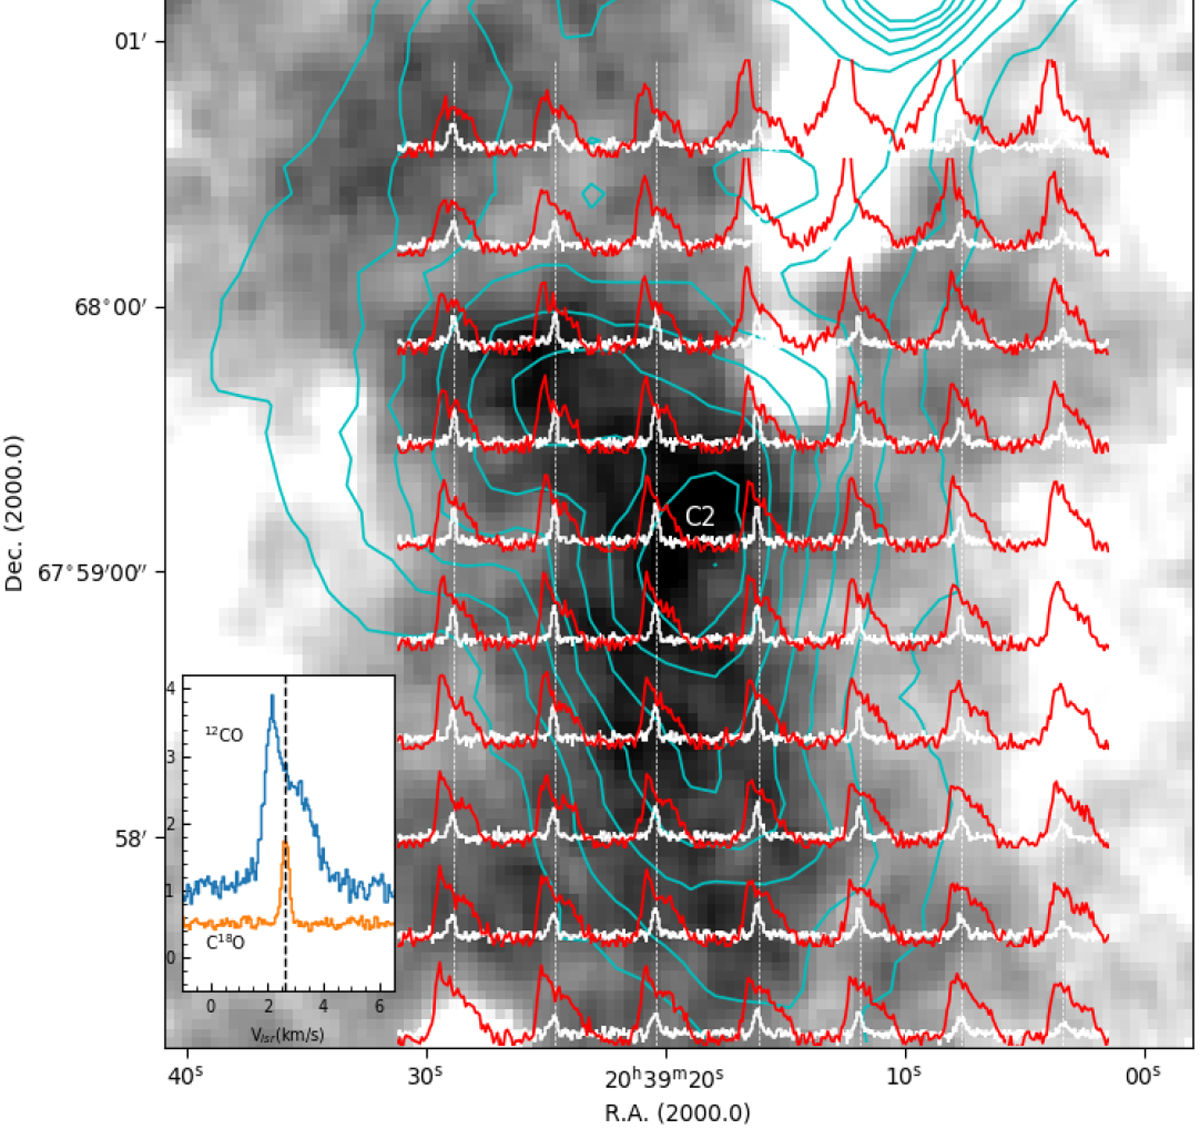
12CO (red) and C18O (white) profiles overlaid on the 12 μm WISE emission map; C2 is marked. The cyan contours show the 250 μm dust intensity emission, and the contour levels are in the range 50–120 MJy sr−1 in steps of 10MJy sr−1. In the inset we show two profiles for the 12CO (blue) and C18O lines (orange) averaged over the half-maximum contour in the intensity map of the N2H+ line.
Current usage metrics show cumulative count of Article Views (full-text article views including HTML views, PDF and ePub downloads, according to the available data) and Abstracts Views on Vision4Press platform.
Data correspond to usage on the plateform after 2015. The current usage metrics is available 48-96 hours after online publication and is updated daily on week days.
Initial download of the metrics may take a while.