Fig. 1
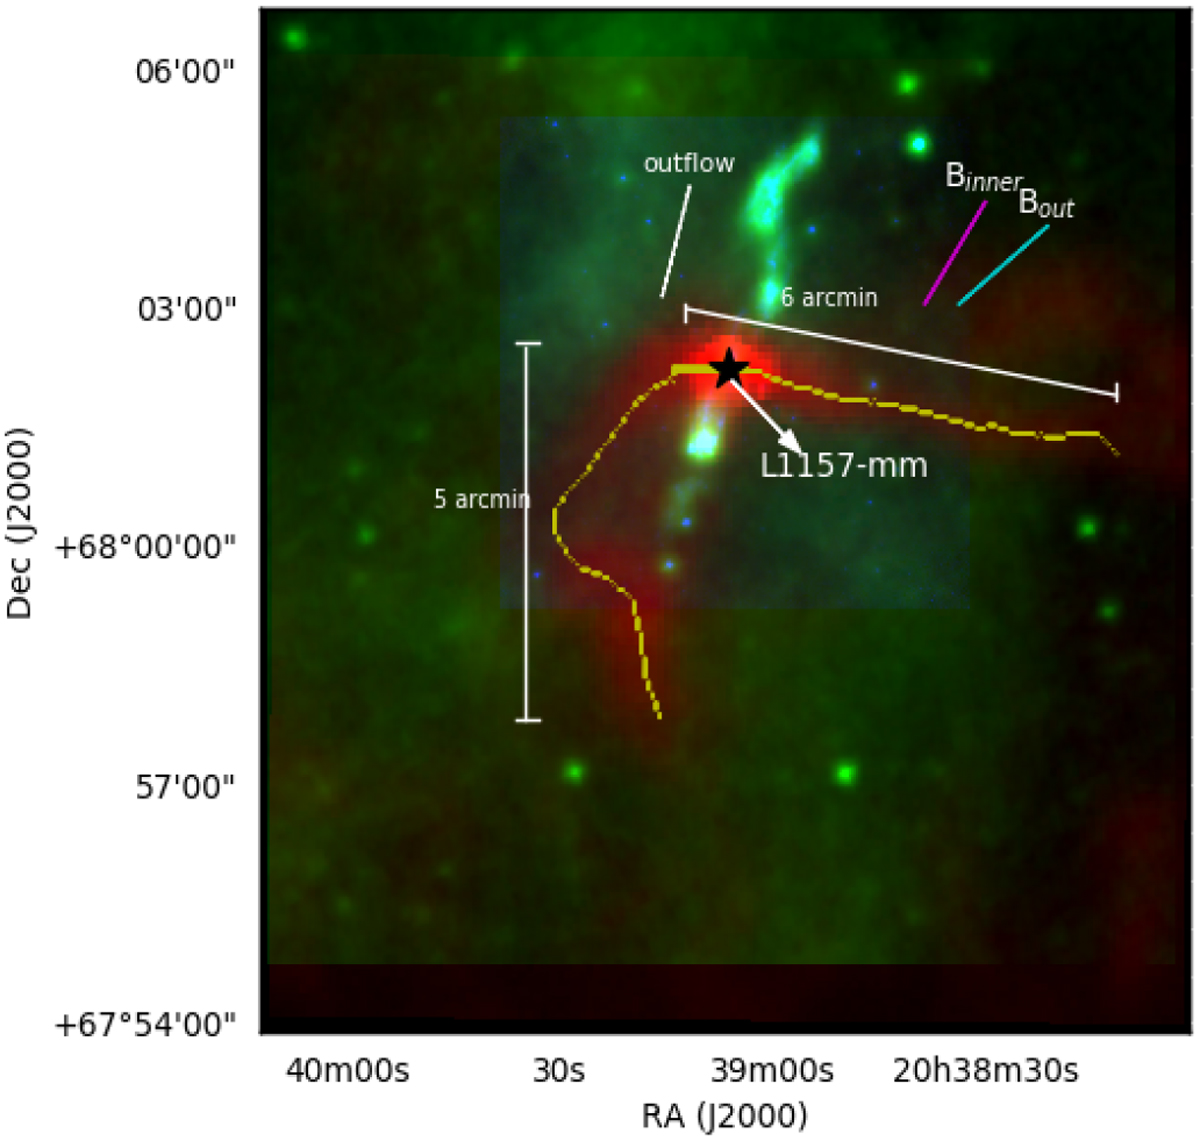
Color-composite image of the filamentary cloud L1157 made using Herschel 250 μm (red), WISE 12 μm (green), and Spitzer 8 μm emission (blue). A filament structure in yellow based on the dust column density (N(H2)) distributionextracted using the Filfinder algorithm is also shown. The white segment shows the orientation of the outflow, and magenta and cyan segments represent the orientation of inner (traced for submm polarization emission measurements) and outer magnetic fields (traced for the optical polarization measurements of background stars), respectively.
Current usage metrics show cumulative count of Article Views (full-text article views including HTML views, PDF and ePub downloads, according to the available data) and Abstracts Views on Vision4Press platform.
Data correspond to usage on the plateform after 2015. The current usage metrics is available 48-96 hours after online publication and is updated daily on week days.
Initial download of the metrics may take a while.