Fig. 8.
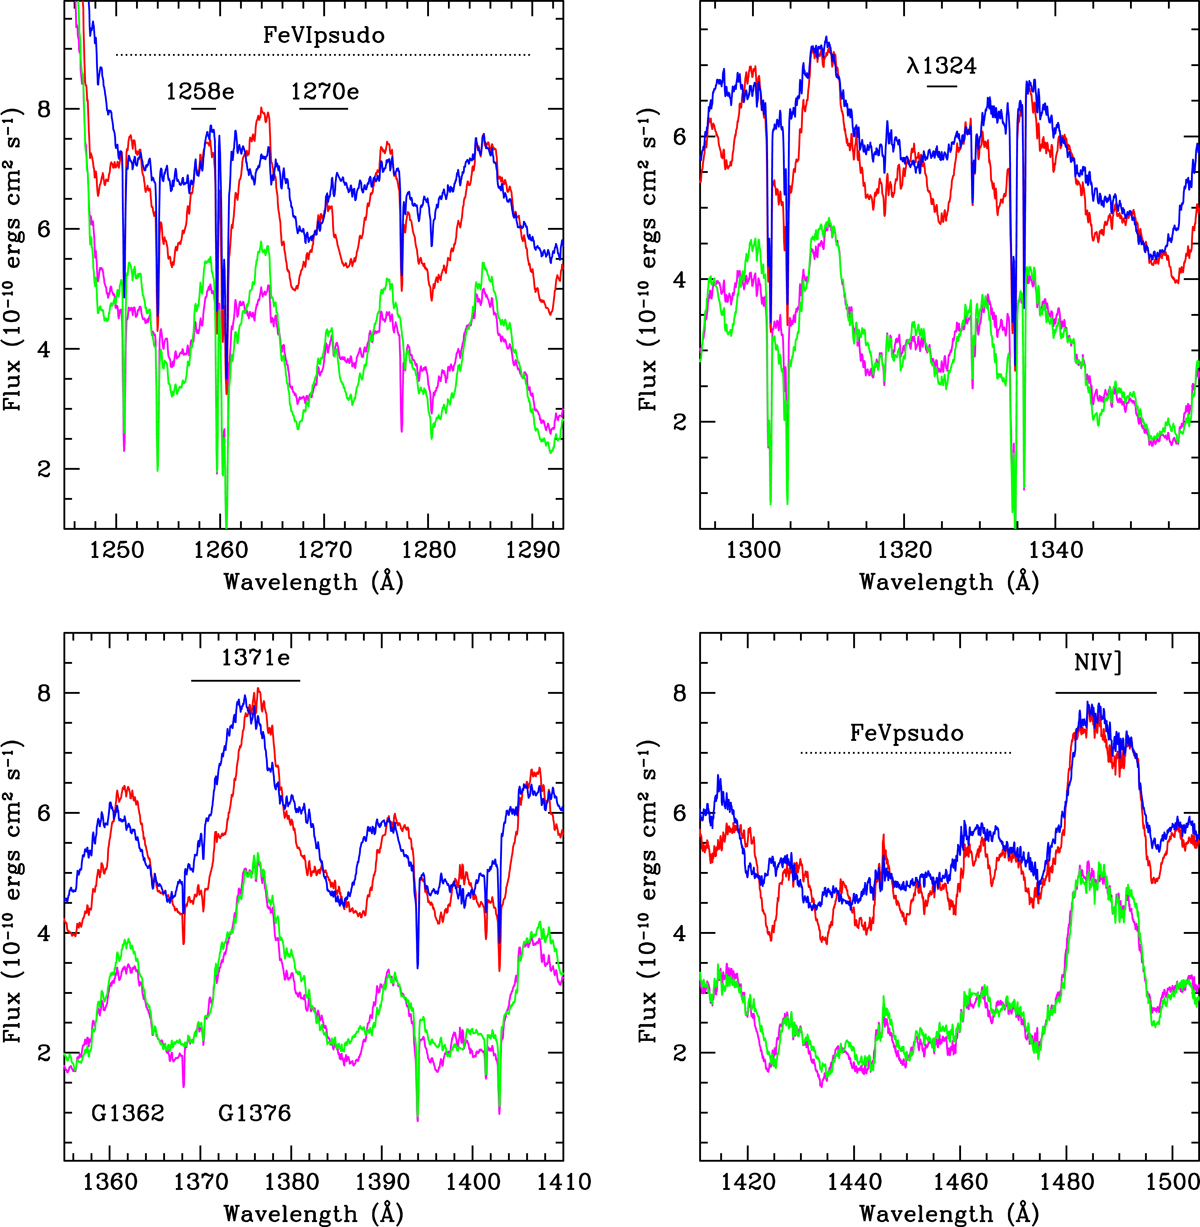
Binned spectra of 1995 at four (sidereal) orbital phases. Low mass companion approaching (ϕS = 0.2–0.3; blue) and receding (ϕs = 0.7–0.8; red). These spectra are shifted vertically for clarity in the figure. The spectra corresponding to conjunctions are at ϕS = 0.9–1.1 (WR in front, magenta) and ϕS = 0.4–0.6 (green). Each panel illustrates a different wavelength region. The horizontal lines enclose wavelength regions defining bands that were used for flux measurements.
Current usage metrics show cumulative count of Article Views (full-text article views including HTML views, PDF and ePub downloads, according to the available data) and Abstracts Views on Vision4Press platform.
Data correspond to usage on the plateform after 2015. The current usage metrics is available 48-96 hours after online publication and is updated daily on week days.
Initial download of the metrics may take a while.