Free Access
Fig. 3.
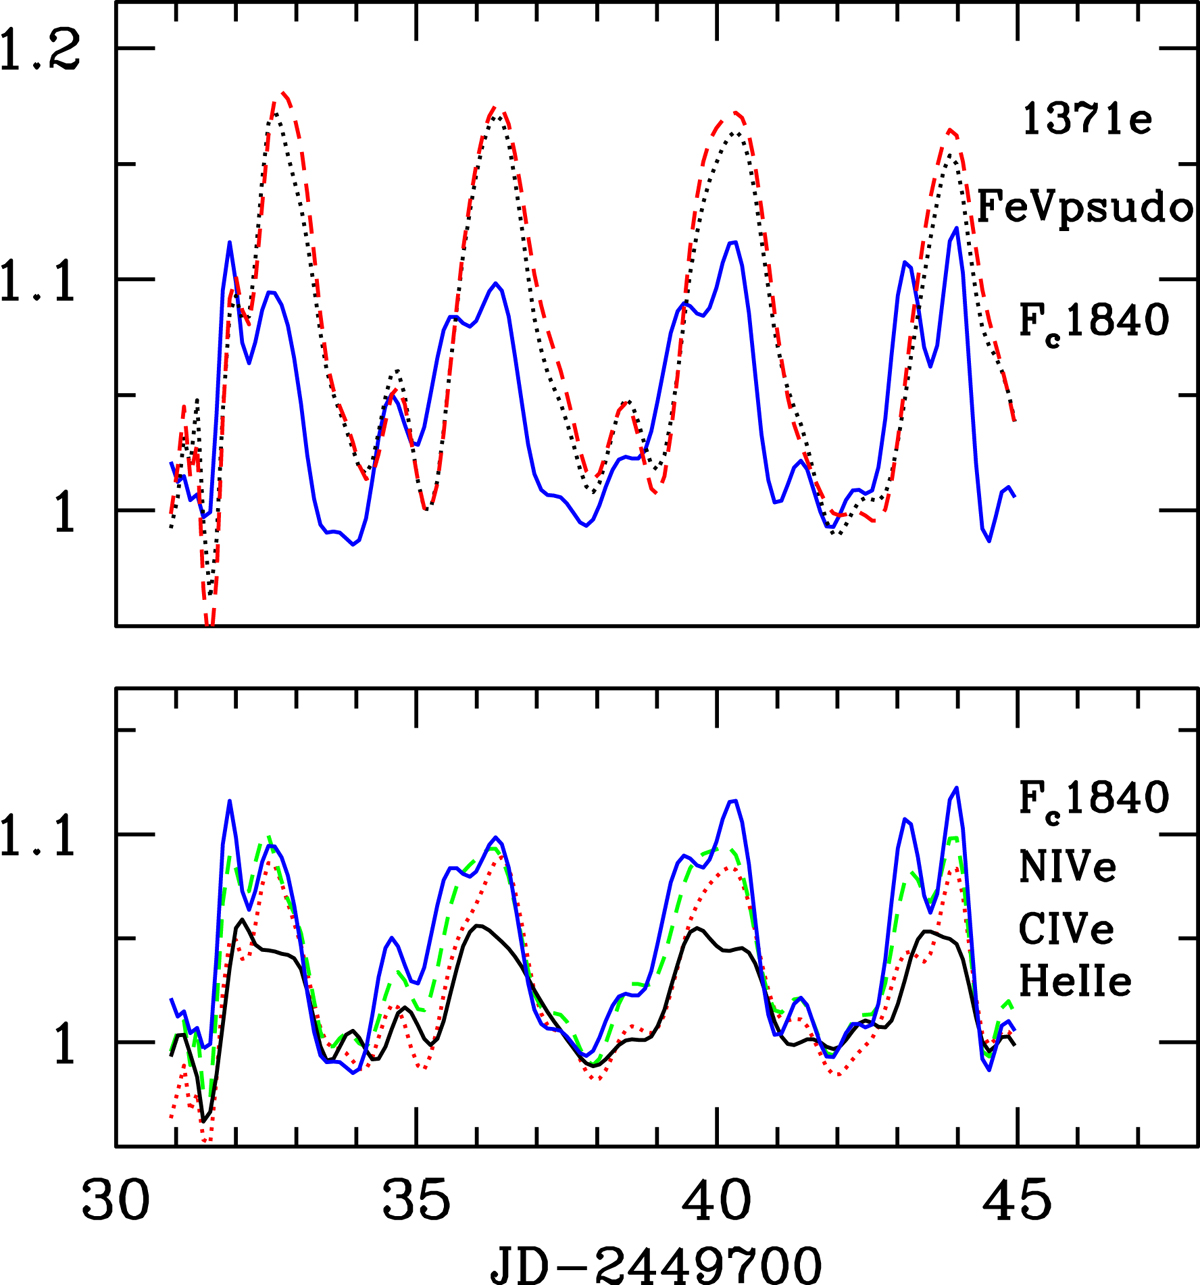
Chebyshev 50-order polynomial fit to the UV fluxes showing the phase lag in ascending and descending intensity branches of the following bands. Top: 1371e (red), FeVpsudo (black) and Fc1840 (blue). Bottom: Fc1840 continuum (blue), NIVe (green) CIVe (red) and HeIIe (black).
Current usage metrics show cumulative count of Article Views (full-text article views including HTML views, PDF and ePub downloads, according to the available data) and Abstracts Views on Vision4Press platform.
Data correspond to usage on the plateform after 2015. The current usage metrics is available 48-96 hours after online publication and is updated daily on week days.
Initial download of the metrics may take a while.