Fig. A.2.
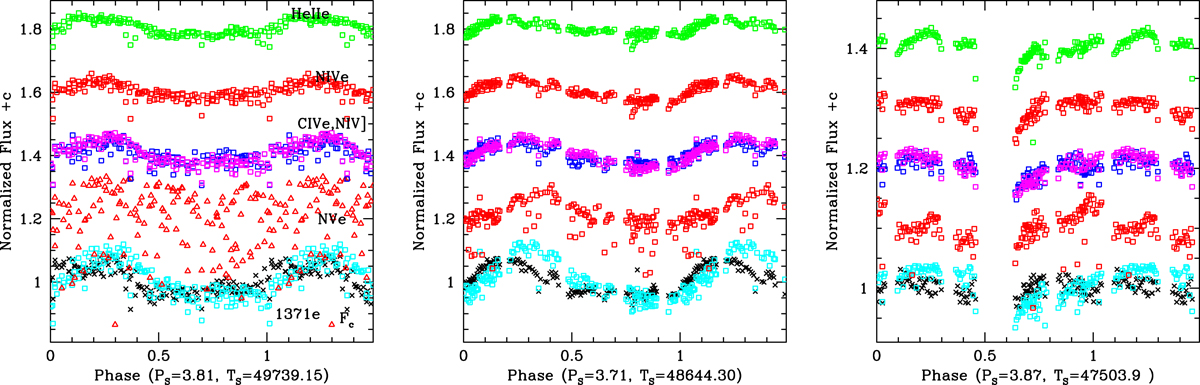
UV fluxes as a function of orbital phase for the epochs 1995 (left), 1992 (middle) and 1988 (right). Each line flux is normalized by the average value of the line for the given epoch. The significantly weaker modulation in 1988 compared to 1992 and 1995 is evident, as is the large cycle-to-cycle dispersion over time in the N V emission flux of 1995.
Current usage metrics show cumulative count of Article Views (full-text article views including HTML views, PDF and ePub downloads, according to the available data) and Abstracts Views on Vision4Press platform.
Data correspond to usage on the plateform after 2015. The current usage metrics is available 48-96 hours after online publication and is updated daily on week days.
Initial download of the metrics may take a while.