Fig. A.1.
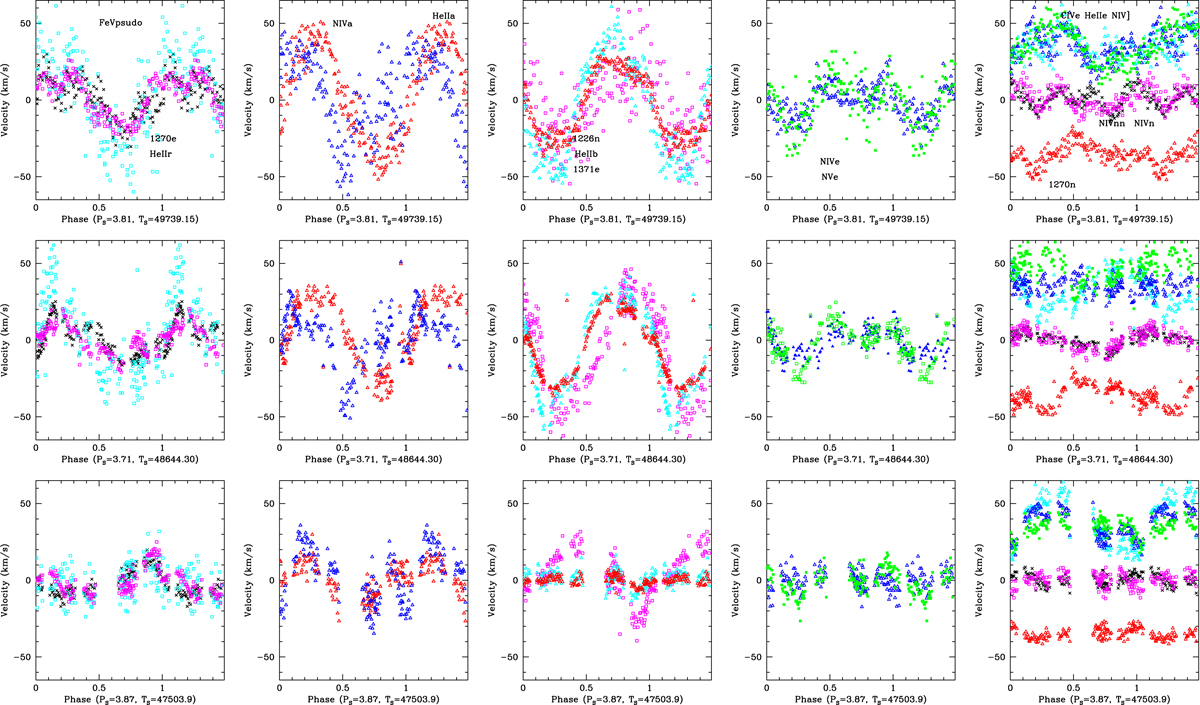
Velocities of lines in IUE spectra folded in phase with (PS, TS) as listed in Table 4. First row: set 1995; second row: set 1992; third row: set 1988. The spectral features that are plotted are labeled in the first row according to the naming convention given in Table A.1 (Col. 3). They correspond to the following: Col. 1: 1270e (black), HeIIr (magenta), FeVpsudo (cyan); Col. 2: HeIIa (red), NIVa (blue); Col. 3: 1226n (magenta), 1371e (cyan), HeIIb (red); Col. 4: NIVe (blue), NVe (green); Col. 5: NIVnn (black), NIVn (magenta), CIVe+35 km s−1 (cyan), HeIIe +35 km s−1 (blue), NIV]+35 km s−1 (green), 1270n-35 km s−1 (red).
Current usage metrics show cumulative count of Article Views (full-text article views including HTML views, PDF and ePub downloads, according to the available data) and Abstracts Views on Vision4Press platform.
Data correspond to usage on the plateform after 2015. The current usage metrics is available 48-96 hours after online publication and is updated daily on week days.
Initial download of the metrics may take a while.