Fig. 10.
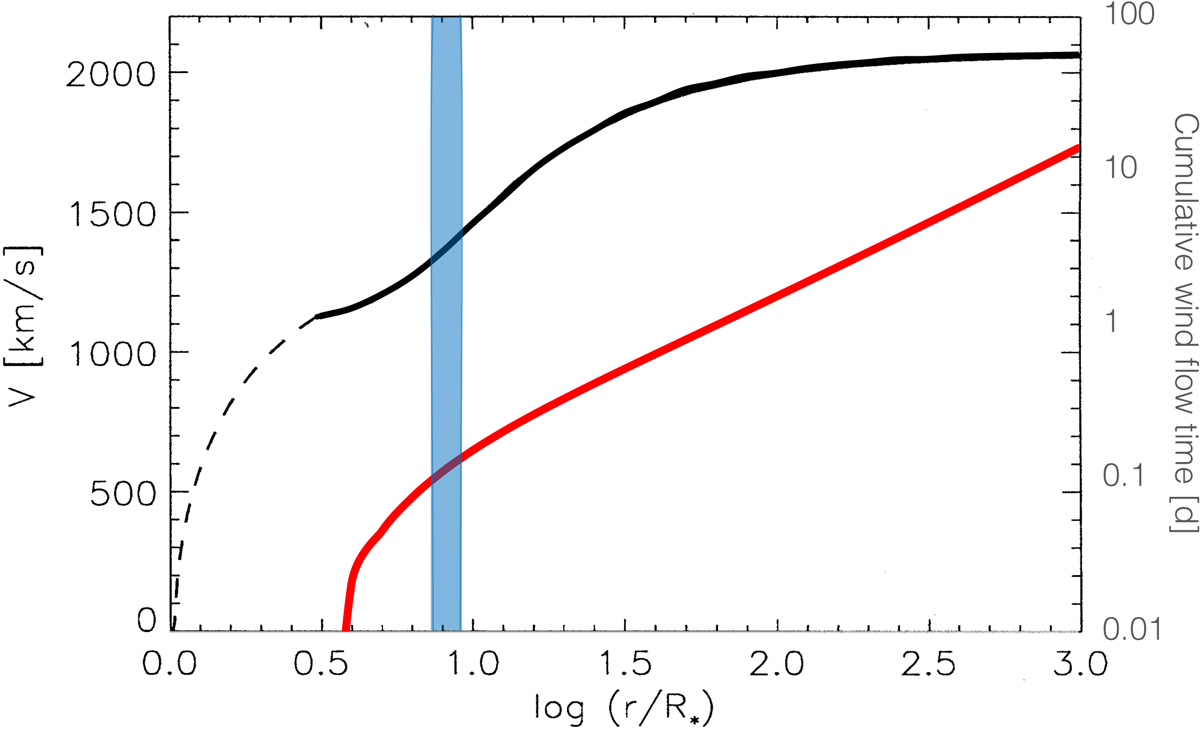
Integrated flow time of the wind (axis on the right) from the calculated velocity law shown in Fig. 10 of Schmutz (1997). The velocity law is shown in black and the cumulative flow time of the wind in red, starting at the photosphere, where the wind optical depth is τ = 1. This corresponds to the model radius 3 R* (= 10 R⊙). The blue rectangle encloses the distance between the two stars at periastron, 26 R⊙ (= 0.87 log10(r/R*)), and apastron, 32 R⊙ (= 0.96 log10(r/R*)).
Current usage metrics show cumulative count of Article Views (full-text article views including HTML views, PDF and ePub downloads, according to the available data) and Abstracts Views on Vision4Press platform.
Data correspond to usage on the plateform after 2015. The current usage metrics is available 48-96 hours after online publication and is updated daily on week days.
Initial download of the metrics may take a while.