Fig. 9.
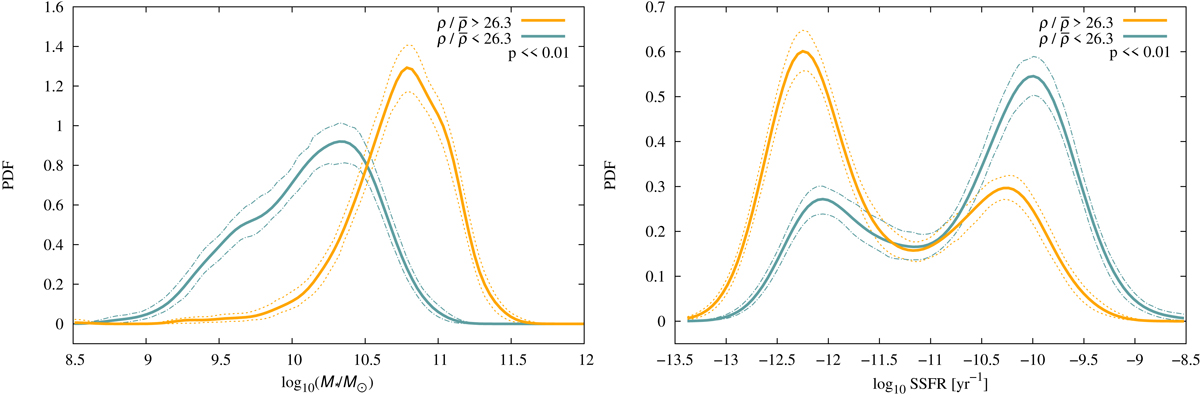
Distributions of stellar mass (left) and SSFR (right) of BGGs split into local high-density and low-density values. The BGGs in our analysis were split based on the mean value of the sample, with the orange line denoting high-density distributions and the blue line low-density distributions. The p-value of a KS-test on each pair of distributions is shown below the legend of each panel. BGG properties are strongly connected to their local densities.
Current usage metrics show cumulative count of Article Views (full-text article views including HTML views, PDF and ePub downloads, according to the available data) and Abstracts Views on Vision4Press platform.
Data correspond to usage on the plateform after 2015. The current usage metrics is available 48-96 hours after online publication and is updated daily on week days.
Initial download of the metrics may take a while.