Fig. 6.
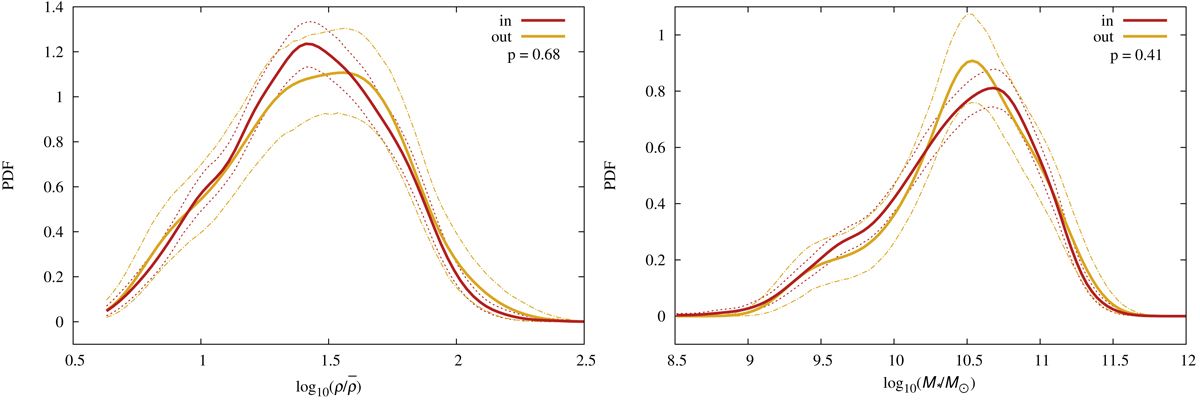
Gaussian-smoothed distributions of BGGs luminosity density field values (left) and stellar masses (right) in two distance bins from the nearest filament spine. The error corridors in each bin show 95% confidence levels calculated using bootstrap resampling. A two-sample KS-test was run on the distributions in each panel. The resulting p-value of the test is shown in the plots. The “in” and “out” samples have comparable distributions of luminosity density and stellar mass.
Current usage metrics show cumulative count of Article Views (full-text article views including HTML views, PDF and ePub downloads, according to the available data) and Abstracts Views on Vision4Press platform.
Data correspond to usage on the plateform after 2015. The current usage metrics is available 48-96 hours after online publication and is updated daily on week days.
Initial download of the metrics may take a while.