Fig. 4.
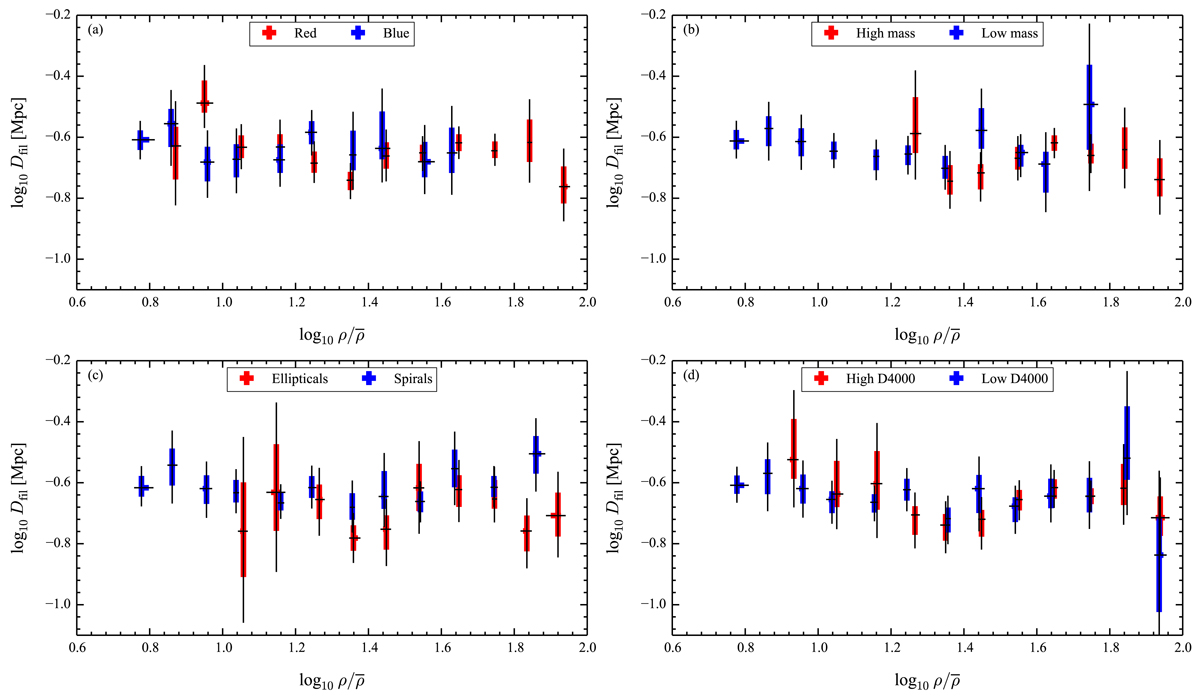
Median distance from the nearest filament spine of BGGs selected in density bins of constant width ![]() . The panels show (a) red and blue, (b) high and low mass, (c) elliptical and spiral, and (d) high and low D4000 BGGs. Only bins with at least ten BGGs are shown. The thicker coloured error bars are 65% and the thinner black bars are 95% confidence intervals calculated using bootstrap resampling. Differences in filament distances are minor and none of the populations are consistently closer to or farther from filament spines.
. The panels show (a) red and blue, (b) high and low mass, (c) elliptical and spiral, and (d) high and low D4000 BGGs. Only bins with at least ten BGGs are shown. The thicker coloured error bars are 65% and the thinner black bars are 95% confidence intervals calculated using bootstrap resampling. Differences in filament distances are minor and none of the populations are consistently closer to or farther from filament spines.
Current usage metrics show cumulative count of Article Views (full-text article views including HTML views, PDF and ePub downloads, according to the available data) and Abstracts Views on Vision4Press platform.
Data correspond to usage on the plateform after 2015. The current usage metrics is available 48-96 hours after online publication and is updated daily on week days.
Initial download of the metrics may take a while.